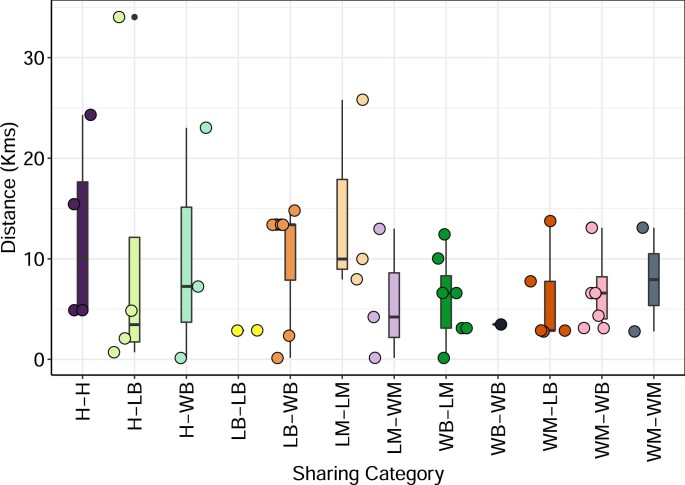
Extended Data Fig. 4. Plot of geographical distance of bacterial sharing in pairs involving different households (n = 49).
Abbreviations: H- Human, LB – Livestock Bird, WB – Wild Birds, LM – Livestock mammals, LB – Livestock Birds. Boxplot centre lines show median value; upper and lower bounds show the 25th and 75th quantile, respectively; upper and lower whiskers show the largest and smallest values within 1.5 times the interquartile range above the 75th percentile and below the 25th percentile, respectively; and points show data points (jittered to improve visualisation).

