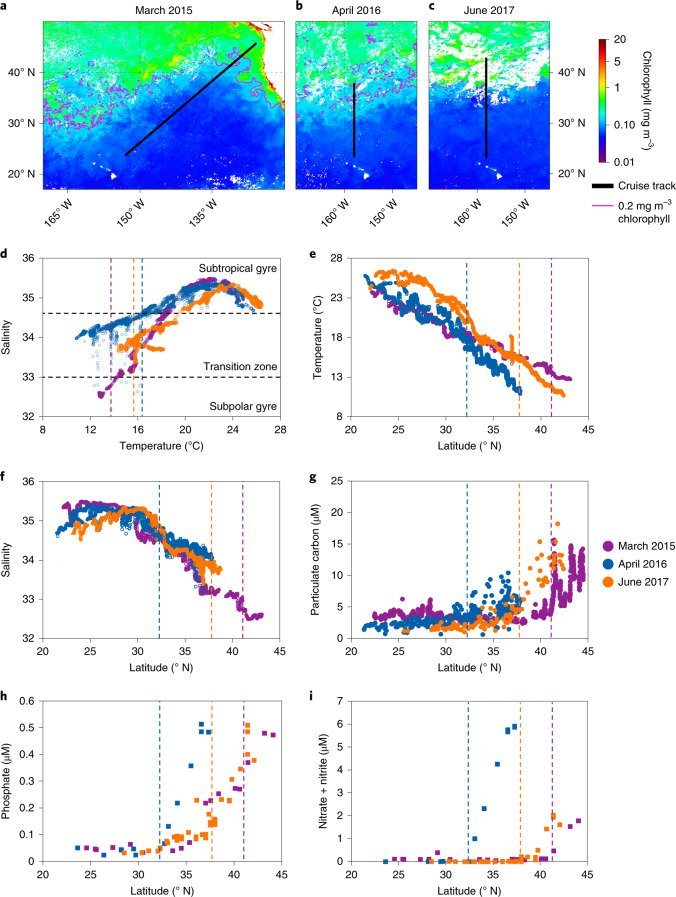
Fig. 1. Gradients in environmental conditions across the North Pacific gyres.
a–c, Transects of three cruises overlaid on monthly averaged satellite-derived sea-surface chlorophyll in March 2015 (a), April 2016 (b) and June 2017 (c). d, Temperature–salinity diagram showing the boundaries of the subtropical and subpolar gyres (black dashed lines) based on the salinity thresholds reported by Roden29. e–i, Temperature (e), salinity (f) as well as the levels of particulate carbon (g), phosphate (h) and nitrate + nitrite (i) as a function of latitude. The coloured dashed lines show the position of the 0.2 mg m−3 chlorophyll contour. For environmental variables plotted against temperature, see Supplementary Fig. 3.

