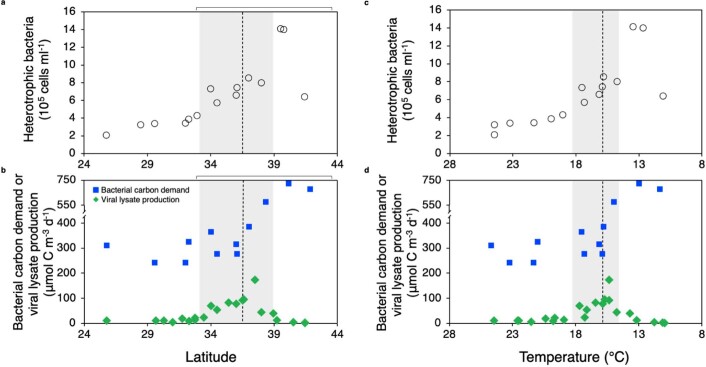
Extended Data Fig. 10. Virus-mediated organic matter production and heterotrophic bacteria abundances across the transects in June 2017.
(a, c) The abundances of heterotrophic bacteria along the June 2017 transects are reproduced from Extended Data Fig. 1 for ease of comparison. (b, d) Estimated bacterial carbon demand (blue) calculated from 3H-Leucine incorporation and an assumed bacterial growth efficiency of 0.15 and virus-mediated lysate production (green) based on daily picocyanobacteria mortality. Dashed lines indicate the 0.2 mg·m−3 chlorophyll front. Shaded regions indicate the position of the cyanophage hotspot and brackets indicate the transition zone.

