
Fig. 2. Shifts in the distributions of Prochlorococcus, Synechococcus and cyanophages in the North Pacific Ocean.
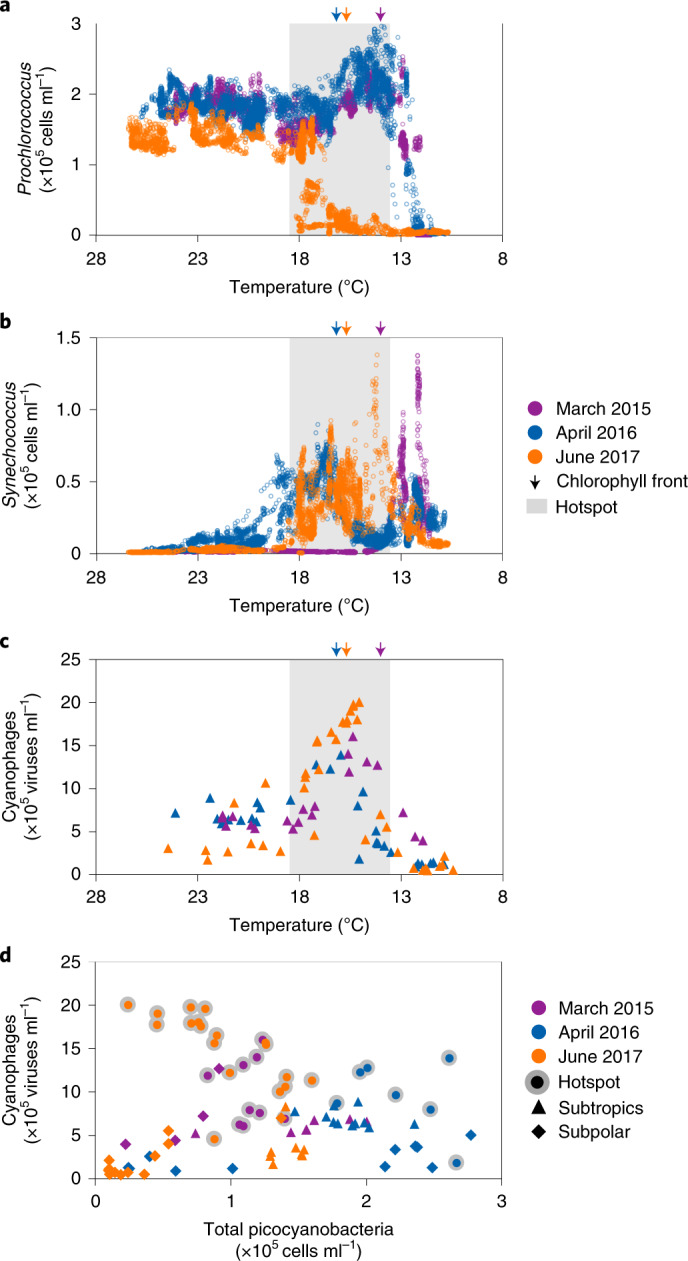
a–c, The distributions of Prochlorococcus (a), Synechococcus (b) and cyanophages (c) were measured at high resolution in the surface waters along the transects of the three cruises in this study and plotted as a function of temperature. d, The relationship between the total numbers of picocyanobacteria and cyanophages. There was no relationship across the data from all regimes (Pearson’s r = −0.008, two-sided P = 0.9, n = 87). Picocyanobacteria correlated positively with cyanophages in the subtropics (Pearson’s r = 0.54, two-sided P = 0.02, n = 26). In the hotspot, the picocyanobacteria abundance correlated negatively with that of cyanophages across all three cruises (Pearson’s r = −0.56, two-sided P = 0.0005, n = 34). There was no relationship found in the subpolar region (Pearson’s r = 0.2, two-sided P = 0.2, n = 27).