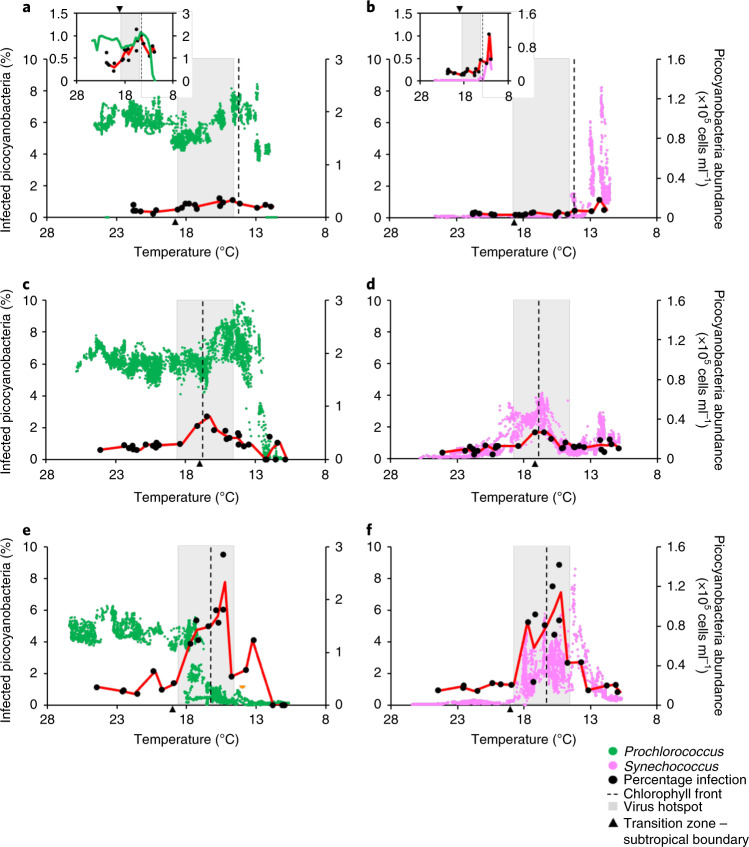
Fig. 4. Viral infection patterns of picocyanobacteria in the North Pacific Ocean.
a–f, Viral infection levels (black) of Prochlorococcus (a,c,e) and Synechococcus (b,d,f) plotted against temperature for the March 2015 (a,b), April 2016 (c,d) and June 2017 (e,f) transects. Insets: infection levels on an expanded scale. The solid lines show infection (red), Prochlorococcus (green) and Synechococcus (pink) averaged and plotted for every 0.5 °C. The dashed lines and shaded regions show the position of the chlorophyll front and the virus hotspot, respectively. For plots by latitude and the upper and lower bounds of infection, see Extended Data Figs. 5 and 6.

