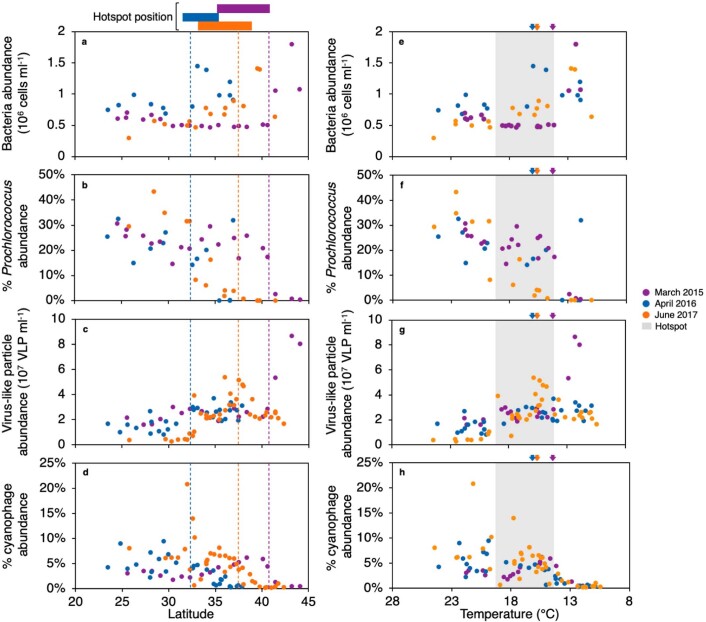
Extended Data Fig. 1. Bacteria and virus abundances across the transects.
Total bacteria (heterotrophic and picocyanobacteria) (a, e), percent Prochlorococcus of total bacteria (b, f), total virus-like particles (c, g), and percent cyanophages of total virus-like particles (d, h) in the surface waters of the North Pacific in March 2015 (purple), April 2016 (blue), and June 2017 (orange). Data are plotted against latitude (a-d) or temperature (e-h). Dashed lines (a-d) or arrows (e-h) show the latitude of the 0.2 mg·m−3 chlorophyll contour as in Fig. 1. Colour bars at the top (a-d) or shaded region (e-h) indicate the position of the virus hotspot.

