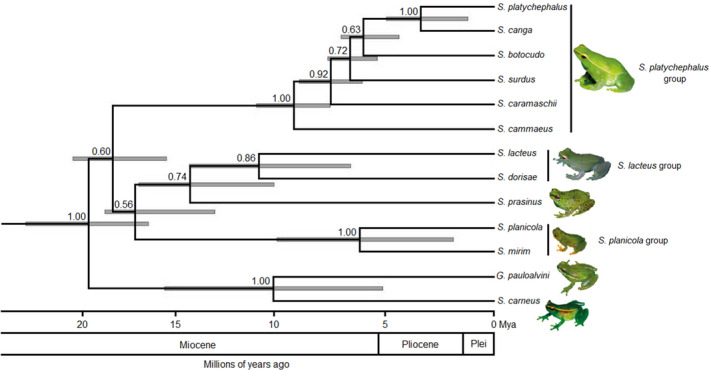
FIGURE 2.

Species tree of the Sphaenorhynchini tribe based on the Bayesian analysis of the 12S, 16S, Cytochrome b, and Tyrosinase genes. Values above the branches indicate posterior probabilities. The scale bar represents the number of substitutions per site. Photos of I.J. Roberto (S. cammaeus – S. platycephalus group) and S. prasinus, F.S.F. Leite (S. canga), C.E. Costa‐Campos (S. carneus), T. Grant (S. lacteus – S. lacteus group), J.L. Gasparini (S. mirim – S. planicola group), and M.T. Rodrigues (G. pauloalvini)
