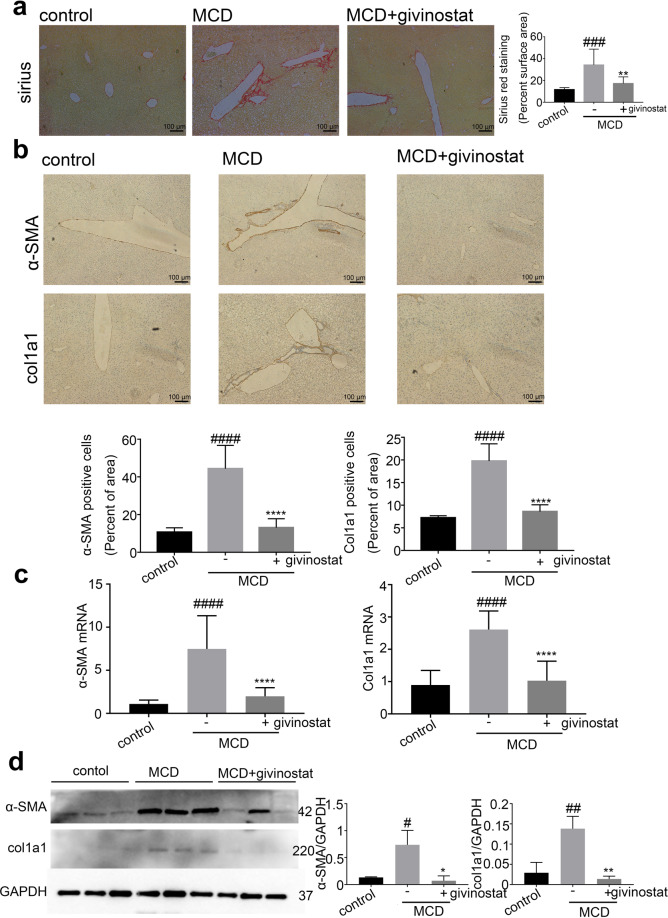
Fig. 2. Givinostat protected against MCD-induced liver fibrosis.
C57BL/6J mice were fed either chow or MCD diet for 8 weeks, and givinostat or vehicle was given simultaneously. a Collagen deposition by Sirius Red staining of livers sections and their quantification shown in the right panel (n = 10 samples from 10 mice per group). b Representative Col1a1 and α-SMA IHC staining, and their quantification shown in the lower panel (n = 10 samples from 10 mice per group). c Representative RT-qPCR analysis of liver Col1a1 and α-SMA mRNA expression. d Representative Western blot analysis of the liver Col1a1 and α-SMA protein expression, with quantification shown in the right panel (n = 10 mice per group). Bars represent mean ± SD. #P < 0.05, ##P < 0.01, ###P < 0.001, ####P < 0.0001 versus control diet-fed mice. *P < 0.05, **P < 0.01, ***P < 0.001, ****P < 0.0001 versus vehicle-treated MCD-fed mice

