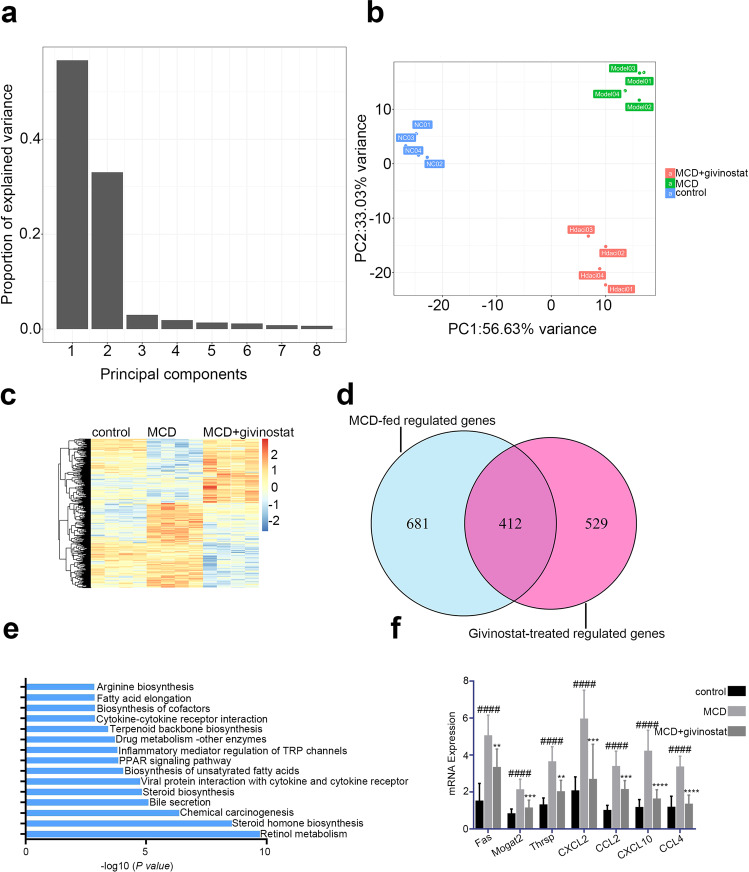
Fig. 3. Givinostat regulated inflammatory and metabolism gene expression in vivo as determined by RNA-Seq analysis.
RNA-seq analysis was performed on liver tissues extracted from mice fed either chow or MCD diet for 8 weeks, and givinostat or vehicle was given simultaneously. (n = 4 mice per group). a, b Principle component analysis among three groups. c The heat map of genes with adjusted P value < 0.05, and absolute value of log2 fold-change > 1.5. d Venn diagram showing the overlap between the gene set of MCD-fed regulated genes and the gene set subsequently regulated by givinostat in vivo. e KEGG pathway analysis using differentially expressed genes between givinostat-treated MCD-fed and vehicle-treated mice, showing that the most significantly enriched pathways are related to the inflammatory and lipid metabolism response. f RT-qPCR analysis was performed to validate the repression of hub genes by givinostat (n = 10 mice per group). Bars represent mean ± SD. ####P < 0.0001 versus control diet-fed mice. **P < 0.01, ***P < 0.001, ****P < 0.0001 versus vehicle-treated MCD-fed mice

