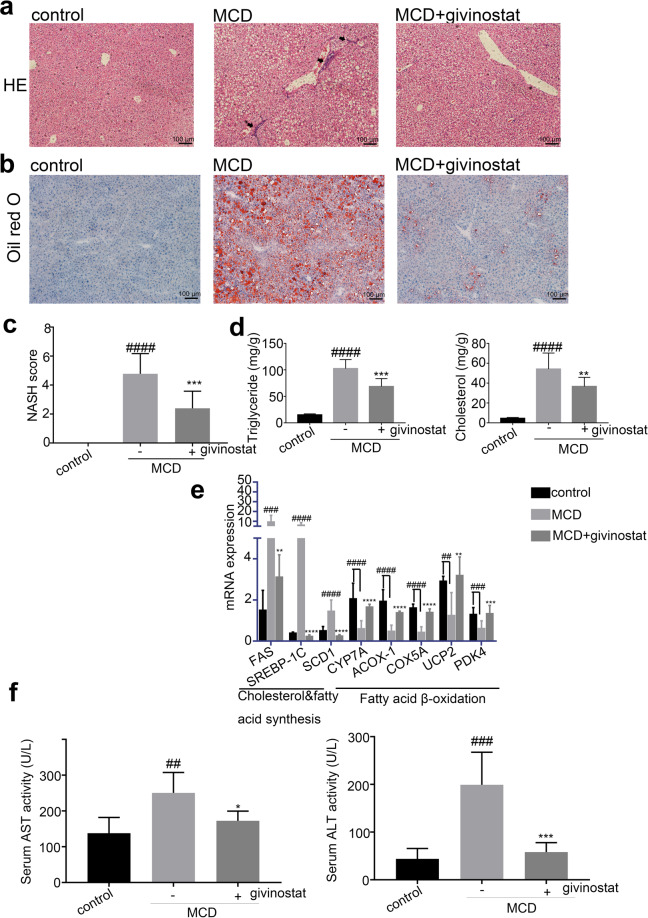
Fig. 4. Givinostat alleviated MCD-induced hepatic steatosis.
C57BL/6J mice were fed either chow or MCD diet for 8 weeks, and givinostat or vehicle was given simultaneously. a Representative images of HE stained liver sections. b Representative images of Oil Red O stained liver sections. c The NASH scores (n = 10 mice per group). d The TG and TC levels in the livers (n = 10 mice per group). e Transcript levels of lipid metabolism-related genes in the livers (n = 10 mice per group). f The plasma AST and ALT levels in mice (n = 10 mice per group). Bars represent mean ± SD. ##P < 0.01, ###P < 0.001, ####P < 0.0001 versus control diet-fed mice. *P < 0.05, **P < 0.01, ***P < 0.001, ****P < 0.0001 versus vehicle-treated MCD-fed mice

