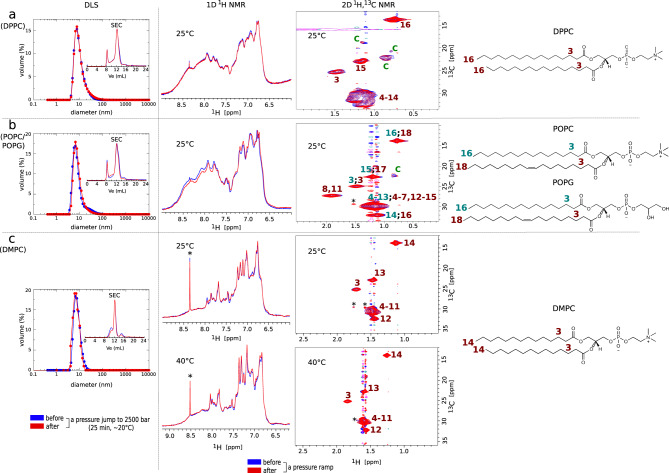
Fig. 1. Barotropic behavior of lipid nanodiscs.
Illustration of the reproducibility of DLS, SEC, and NMR data (a: DPPC; b: POPC/POPG; c: DMPC) of empty, i.e., without MP, nanodiscs collected at atmospheric pressure before and after a pressure jump to 2500 bar during 25 min (DLS and SEC experiments) or ramp (NMR experiments) (see Methods). For DLS and SEC experiments, the graphs represent the volume-weighted distribution function of the diameter of nanodiscs in nm and the absorbance at 280 nm in the function of the volume of elution (the y axis has been removed for clarity), respectively. One-dimensional (1D) 1H NMR spectra represent a close-up in the region of amide, amine, and aromatic protons of the lipoprotein MSP1D1 and 2D 1H,13C spectra are plotted in the CH2 and CH3 resonance region of the lipid acyl chains. The numbers on the 2D NMR spectra indicate the CHn (n = 2 or 3) moieties composing the lipid acyl chains indicated on the chemical structures on the right (NMR assignments are based on abundant literature, e.g., ref. 66) and the letter C in green indicates some signals of the cholesterol in the case of POPC/POPG and DPPC nanodiscs. The asterisk symbols in 1D and 2D experiments indicate residual traces of imidazole and weak signals that could correspond to CH2 moieties spatially close to the lipoprotein, respectively.

