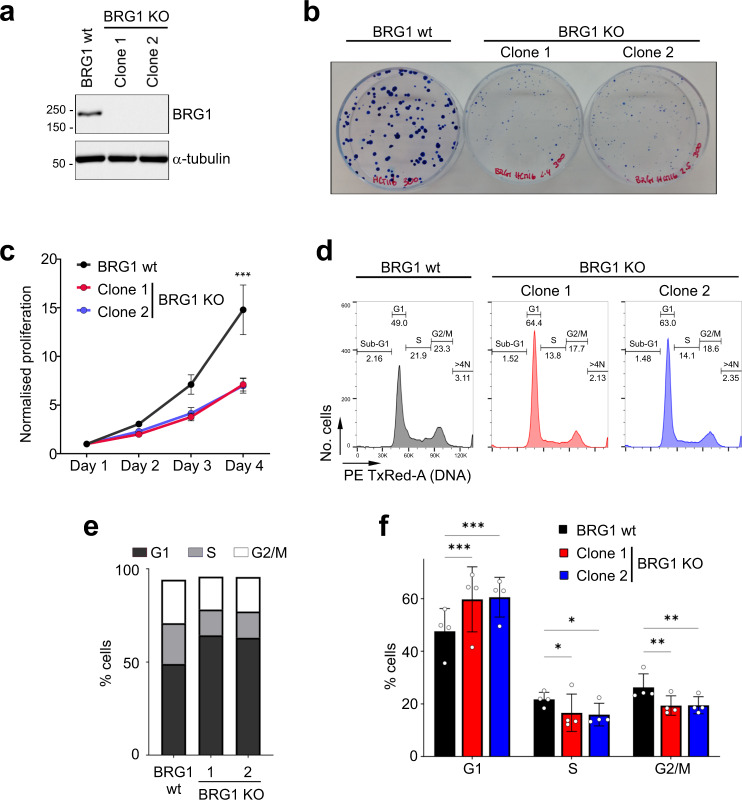
Fig. 1. BRG1 loss leads to a loss of fitness and altered cell cycle profile.
a Western blot analysis of BRG1 in whole-cell extracts prepared from HCT116 cells and two HCT116-derived BRG1 knockout clonal cell lines. α-tubulin was used as a loading control. Similar results were obtained in three independent repeats. b Clonogenic assay showing the difference in colony size between HCT116 cells and two BRG1 knockout clones grown for 10 days. c Normalised proliferation from three independent experiments monitored by CellTiter-Glo Luminescent Cell Viability assay between HCT116 cells and two BRG1 knockout clones. Data were presented as the mean ± SEM; n = 3. The p value was calculated with two-way ANOVA-Dunnet. ***p < 0.001. d BRG1-deficient cells have an altered cell cycle profile. DNA content was analysed by flow cytometry and representative profiles of the HCT116 or BRG1 knockout clones are shown. e Quantification of cells (%) in each cell cycle phase of cells analysed by flow cytometry in d. f Quantification of cells (%) in G1, S and G2/M cell cycle phases from flow cytometry profiles in HCT116 and BRG1 knockout cells. Data were presented as the mean ± SD; n = 4. The p value was calculated with two-way ANOVA-Dunnett. *p < 0.05, **p < 0.01 and ***p < 0.001.

