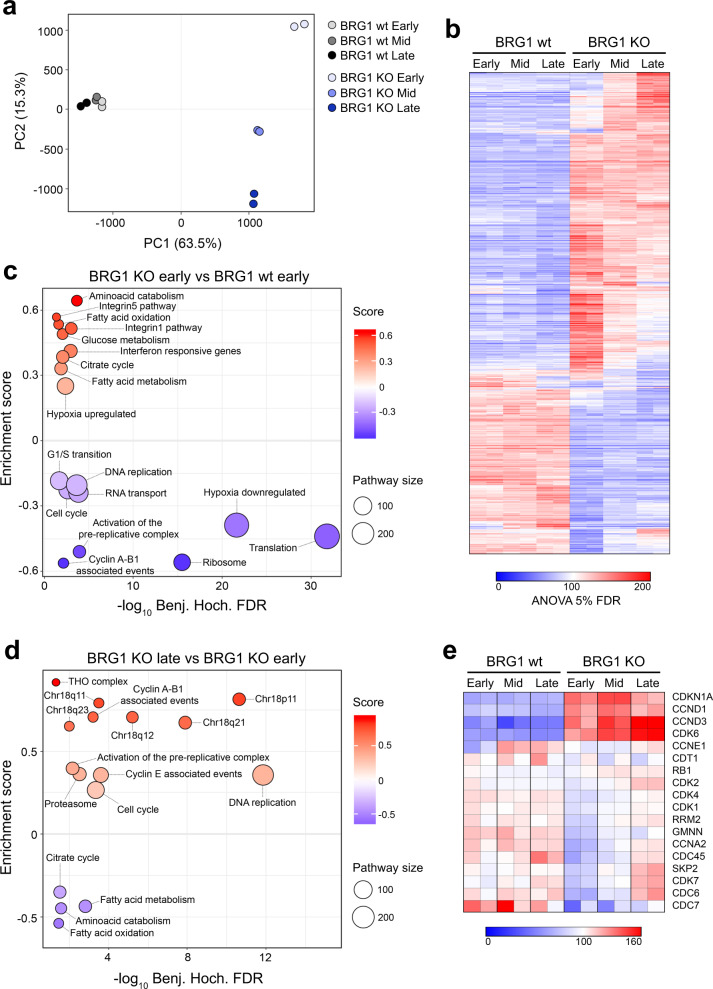
Fig. 4. The proteome of BRG1-deficient cells shows striking differences from the parental HCT116 cells and evolves over time.
a Principal component analysis (PCA) of the proteomic profiles from HCT116 and BRG1 knockout (KO) cells (clone 2) from early, mid (4 months) and late (8 months) time points. Two 6plex proteomics experiments were performed and the dots represent biological replicates. b Heatmap of the proteome data using row-scaled protein abundances for the top 30% most variable proteins (based on standard deviation) with significant differential regulation (ANOVA FDR <5%). The colour key indicates the relative abundance of each protein (scale: 0–200). Duplicates are shown side by side. c Pathway enrichment analysis showing differentially regulated pathways in BRG1-deficient (KO) HCT116 at early time points compared with the parental HCT116 cells. Upregulated pathways (in red) and downregulated pathways (in blue) are shown according to the enrichment score. Dot size varies accordingly to the size of the pathway. d Pathway enrichment analysis showing changes in BRG1-deficient (KO) cells over time. For the analysis, the proteome from BRG1-deficient cells at late (8 months) time points was compared to the proteome of BRG1-deficient cells at early time points. Only pathways that are differentially regulated in the BRG1 KO cells and stable in wild-type cells over time are shown. Upregulated pathways (in red) and downregulated pathways (in blue) are shown according to the enrichment score. Dot size varies accordingly to the size of the pathway. e G1/S cell cycle pathway proteins are altered in BRG1 knockout cells. A scaled abundance of proteins involved in G1/S transition. HCT116 and BRG1-deficient HCT116 cells were compared at early, mid (4 months) and late (8 months) time points. The colour key indicates the relative abundance of each protein (scale: 0–160). Duplicates are shown side by side.

