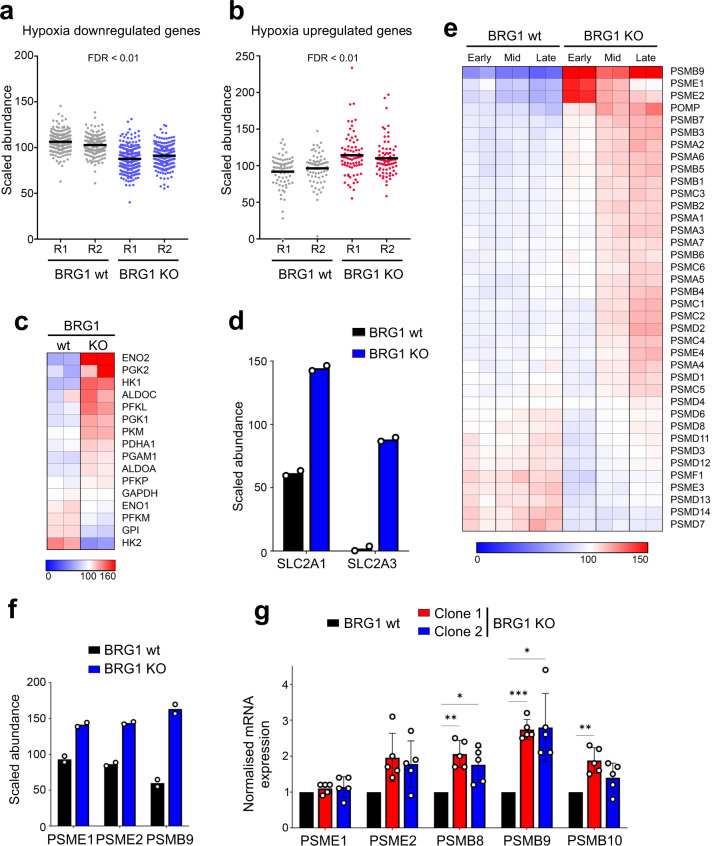
Fig. 5. BRG1-deficient cells show changes in pathways associated with tolerance to aneuploidy at early time points.
a Scaled abundance of hypoxia proteins with a downregulation trend (GSEA gene list MANALO_HYPOXIA_DOWN) by proteome analysis in HCT116 and BRG1 knockout (KO) cells at early time points. Duplicates are represented as R1 and R2. b Scaled abundance of hypoxia proteins with upregulation trend (GSEA gene list MANALO_HYPOXIA_UP) by proteome analysis in HCT116 and BRG1 KO cells at early time points. Duplicates are represented as R1 and R2. c Heatmap showing a scaled abundance of glycolysis proteins in HCT116 and BRG1 KO cells at early time points. Duplicates are shown side by side. The colour key indicates the relative abundance of each protein (scale: 0–160). d Scaled abundance of SLC2A1 and SLC2A3 glucose importers by proteome analysis in HCT116 and BRG1-deficient cells at early time points. Data were presented as the mean; n = 2. e Heatmap showing scaled abundance of proteasome proteins in HCT116 and BRG1-deficient (KO) cells at early, mid and late time points. Duplicates are shown side by side. The colour key indicates the relative abundance of each protein (scale: 0–150). f Scaled abundance of immunoproteasome subunits by proteome analysis in HCT116 and BRG1-deficient (KO) cells at early time points. Data were presented as the mean; n = 2. g mRNA expression of immunoproteasome subunits in HCT116 and two BRG1-deficient (KO) clones by RT-PCR analysis. The values have been normalised to GAPDH expression. Data were presented as the mean ± SD; n = 5. The p value was calculated with two-way ANOVA-Dunnett. *p < 0.05, **p < 0.01 and ***p < 0.001.

