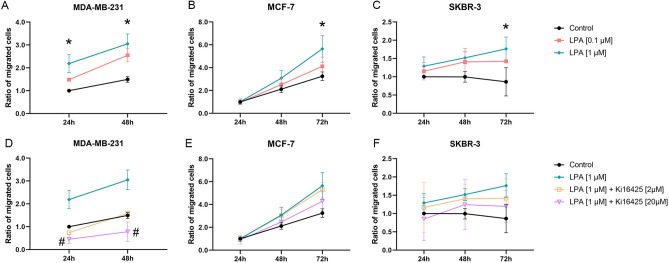
Figure 2.
Migration assay. Effect of lysophosphatidic acid (LPA) 18:1 and the LPA receptor 1, 3 (and 2) inhibitor Ki16425 on migration after 24 h, 48 h, and 72 h of different human breast cancer cell lines (control 24 h = 1). (A–C) Data points show the ratio of migrated cells (y-axis) with the addition of varying concentrations of LPA compared to the control group for several time points (x-axis). (D–F) Data points show the ratio of migrated cells (y-axis) with the addition of 1.0 µM LPA and Ki16425 in varying concentrations as well as the control group for several time points (x-axis). n = 3 replicate experiments, values are presented as mean ± SD. *: p ≤ 0.05 compared to the control group; #: p ≤ 0.05 compared to 1.0 μM LPA (Kruskal–Wallis test and post-hoc Dunn’s test).

