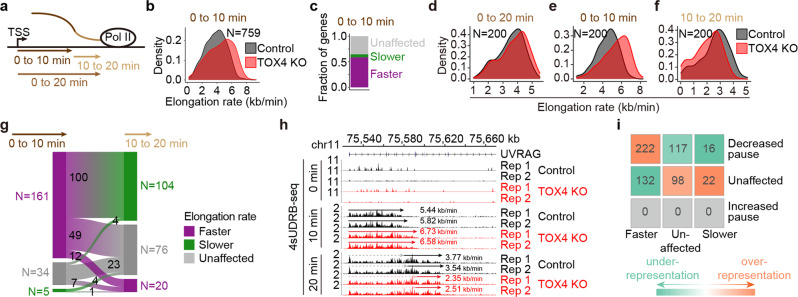
Fig. 4. TOX4 may restrict early elongation but promote late productive elongation of Pol II.
a Schematic representation of experimental design of the 4sUDRB-seq. Labeled RNA was extracted at 0, 10, and 20 min after DRB removal. b Density plots comparing Pol II elongation rates of 759 TOX4-bound genes in control and TOX4 KO cells, for which high confidence elongation rates from 0 to 10 min after DRB removal could be determined. c A bar graph categorizing Pol II elongation rate changes of the above-mentioned 759 TOX4-bound genes in TOX4 KO versus control cells. d–f Density plots comparing Pol II elongation rates from 0 to 20 min (d), 0 to 10 min (e), and 10 to 20 min (f) after DRB removal of 200 TOX4-bound genes in control and TOX4 KO cells, for which high confidence elongation rates from 0 to 10 min and 0 to 20 min could be determined. g A Sankey diagram visualizing Pol II elongation rate changes from 0 to 10 min and 10 to 20 min of 200 TOX4-bound genes described in d–f. Heights of rectangles and widths of “streams” between rectangles each are proportional to gene counts, which are shown either aside of the rectangles or inside of the “streams”. h Normalized 4sUDRB-seq read distribution at 0, 10 and 20 min after DRB removal within the UVRAG locus in control and TOX4 KO cells. i A heatmap of standardized residuals of the chi-square test of independence between Pol II elongation rate changes from 0 to 10 min after DRB removal and Pol II TR changes upon TOX4 loss. Overlapping gene counts between categories are shown in the cells.

