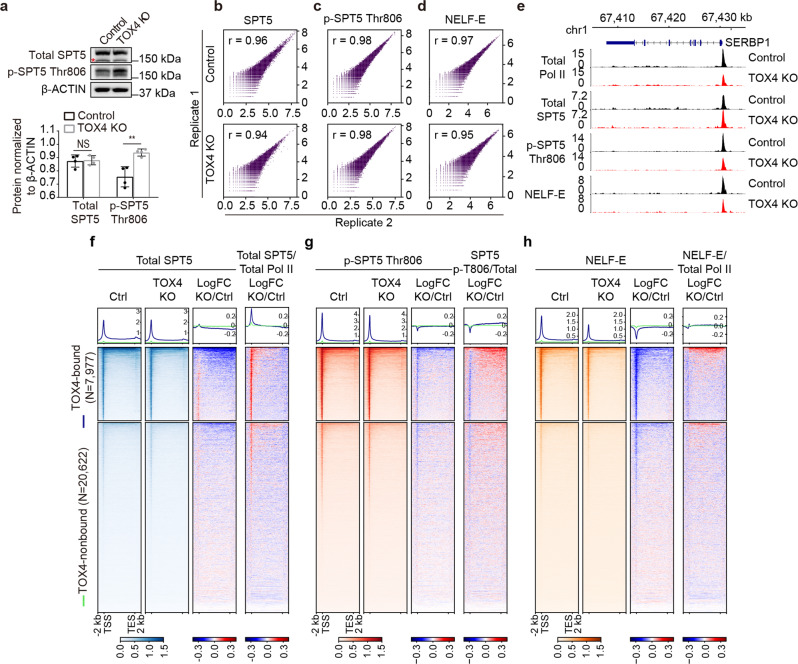
Fig. 5. TOX4 may restrict early elongation by facilitating SPT5 Thr-806 dephosphorylation.
a Comparison of cellular levels of SPT5 and p-SPT5 Thr-806 by Western blot in control and TOX4 KO cells. Top: Western blot images with nonspecific bands highlighted by a “*”, Bottom: A bar graph showing relative levels of p-SPT5 Thr-806 quantified by ImageJ in control and TOX4 KO cells. Pictures are representative of four independent experiments. Statistical significance was determined with a two-sided Student’s t-test; the centers and the error bars represent the mean and the SD, respectively. NS: P ≥ 0.05, *P < 0.05, **P < 0.01. b–d Correlation plots for biological replicates of CUT&Tag of SPT5 (b), p-SPT5 Thr-806 (c), and NELF-E (d). e Normalized CUT&Tag read distribution of Pol II, SPT5, p-SPT5 Thr806 and NELF-E within the SERBP1 locus in TOX4 KO versus control cells. f–h Genome-wide meta-gene profiles and heatmaps of CUT&Tag comparing chromatin occupancies of SPT5 (f), p-SPT5 Thr-806 (g), and NELF-E (h) in TOX4 KO versus control cells. Genes were sorted by total Pol II CUT&Tag signal in control cells.

