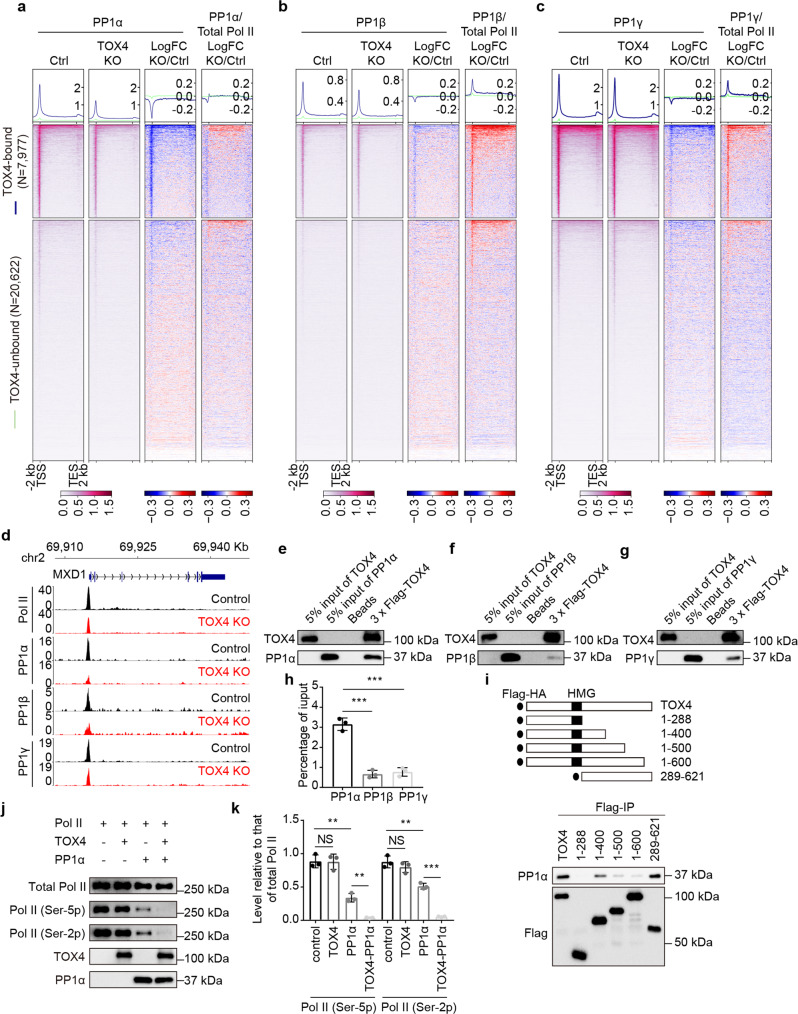
Fig. 6. TOX4 preferentially binds PP1α and facilitates Pol II CTD dephosphorylation.
a–c Genome-wide meta-gene profiles and heatmaps of CUT&Tag comparing chromatin occupancies of PP1α (a), β (b), and γ (c) and relative chromatin occupancies of them to that of total Pol II in TOX4 KO versus control cells. Genes were sorted by total Pol II CUT&Tag signal in control cells. d Normalized CUT&Tag read distribution of Pol II, PP1α, PP1β, and PP1γ within the MXD1 locus in TOX4 KO versus control cells. e–g Western blot analyses of in vitro binding assays between TOX4 and PP1α (e), β (f), or γ (g). h A bar graph comparing percentage of PP1α, β, or γ co-immunoprecipitated with TOX4 in in vitro binding assays quantified by ImageJ. i Western blot analyses of co-IP experiments between PP1α and fragments of TOX4. j Western blot analyses of in vitro phosphatase assay using purified PP1α, TOX4, TOX4-PP1α, and Pol II. k A bar graph comparing levels of Ser-2 phosphorylated Pol II and Ser-5 phosphorylated Pol II in in vitro phosphatase assays quantified by ImageJ. Pictures in e–g, and j are representative of three independent experiments. Statistical significance in h, k was determined with a two-sided Student’s t-test; the centers and the error bars represent the mean and the SD, respectively. NS: P ≥ 0.05, *P < 0.05, **P < 0.01, ***P < 0.001.

