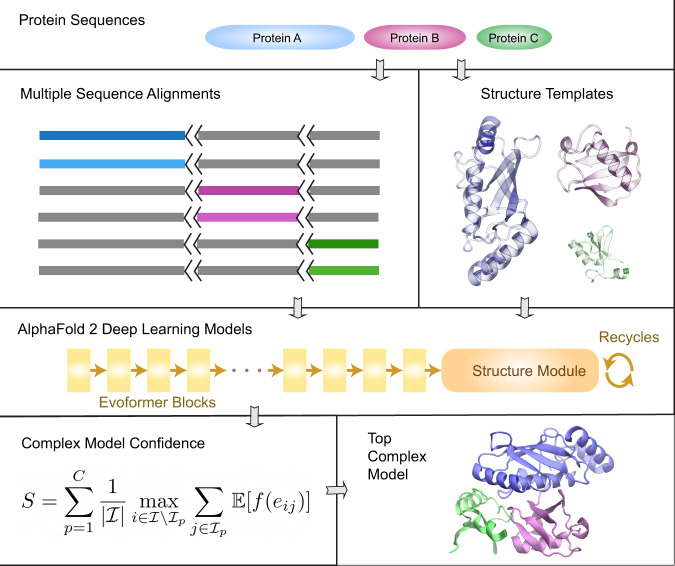
Fig. 1. Overview of the AF2Complex workflow.
The multiple sequence alignments of query protein sequences A (blue), B (purple), and C (green) are joined together by padding gaps (grey) in the MSA regions belonging to other proteins, and the short black lines represent an increase in the residue index to distinguish separate protein chains. Structure templates for individual proteins are also retrieved from the Protein Data Bank. Using these sequence and template features, an AF2 DL model generates a complex model after multiple recycles. The interface residues between proteins in the final complex model are then identified and their interface-score S is calculated to rank model confidence.

