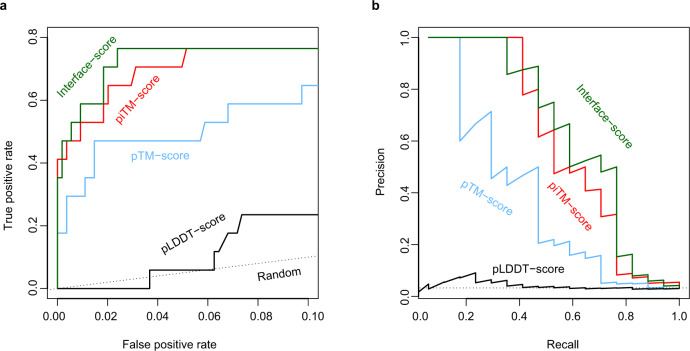
Fig. 4. Identification of true interacting protein pairs in the all-against-all pool for the CP17 set by various confidence metrics.
a Receiver operating characteristic curve and (b) the precision-recall curve. The random curve is the expected result by randomly guessing interacting protein pairs. piTM-, pTM- and pLDDT-score denote predicted interface TM-score, predicted TM-score, and predicted local distance difference test score, respectively.

