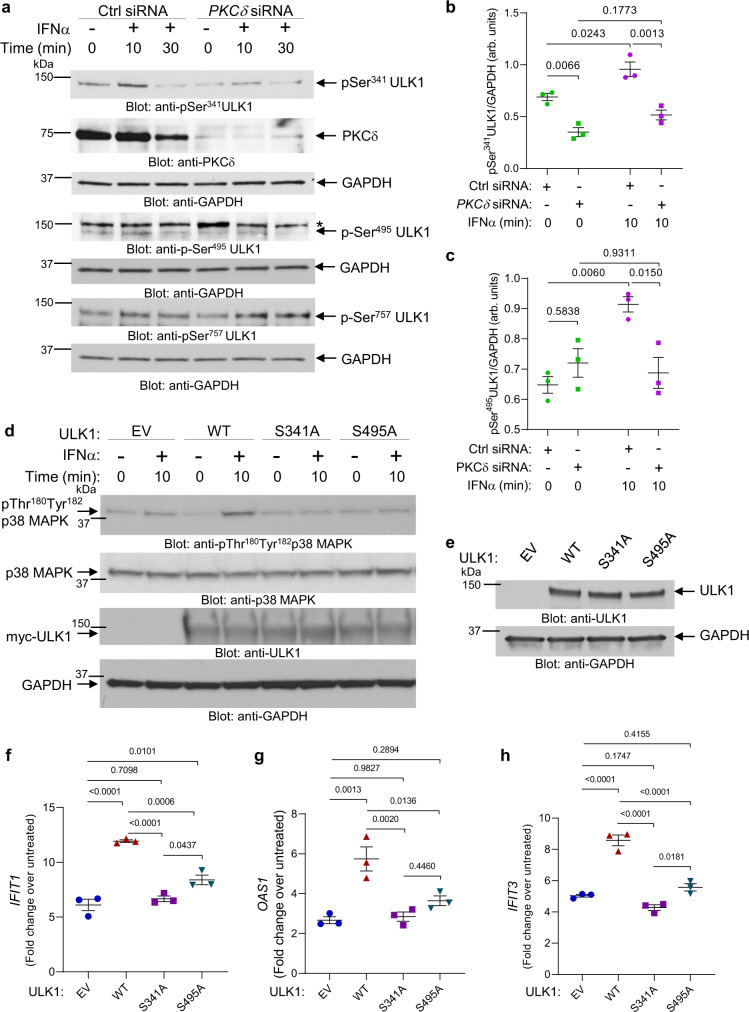
Fig. 2. Type I IFN-induced PKCδ-dependent phosphorylation of ULK1 on serine residues 341 and 495 is required for ULK1-mediated activation of p38 MAPK and consequent expression of ISGs.
a U937 cells were transfected with either control siRNA or PKCδ siRNA. 24 h later, cells were starved overnight (cultured in RPMI medium without FBS) and then were either left untreated or were treated with IFNα (104 IU/mL) for 10 or 30 min, as indicated. Immunoblotting analysis was performed for the indicated proteins. Blots are representative of three independent experiments. *unspecific band. b, c Bands for the indicated proteins were scanned and quantified for untreated and 10 min IFNα-treated samples by densitometry, using ImageJ software. Quantified data are means ± SEM of pULK1/GAPDH from three independent experiments. Adjusted p-values are reported by two-way ANOVA followed by Tukey’s multiple comparisons test to assess the differences in ULK1 phosphorylation on Ser341 and Ser495 with treatment (untreated vs. IFNα), siRNA (Ctrl siRNA vs. PKCδ siRNA) and their interaction as predictors. arb. units, arbitrary units. d Immunoblotting analysis of p-p38 MAPK in lysates from Ulk1/2−/− MEFs transfected with myc-tagged empty vector (EV), ULK1 WT, ULK1S341A or ULK1S495A plasmids treated with IFNα (104 IU/mL) for 10 min, as indicated. Blots are representative of three independent experiments. e–h ULK1 KO KT-1 cells were transfected with myc-tagged empty vector (EV), ULK1 WT, ULK1S341A or ULK1S495A plasmids. e Immunoblotting analysis of ULK1 in lysates from ULK1 KO KT-1 transfected cells, as indicated. Blots are representative of three independent experiments. f–h qRT-PCR analysis of (f) IFIT1, (g) OAS1, and (h) IFIT3 in ULK1 KO KT-1 transfected cells treated for 6 h with IFNα (5000 IU/mL). Shown is mRNA expression fold change over respective untreated ULK1 KO KT-1 transfected cells. Data are means ± SEM from three independent experiments. Adjusted p-values are reported by one-way ANOVA followed by Tukey’s multiple comparisons test. See also Supplementary Figs. 1–3. Source data are provided as a Source Data file.

