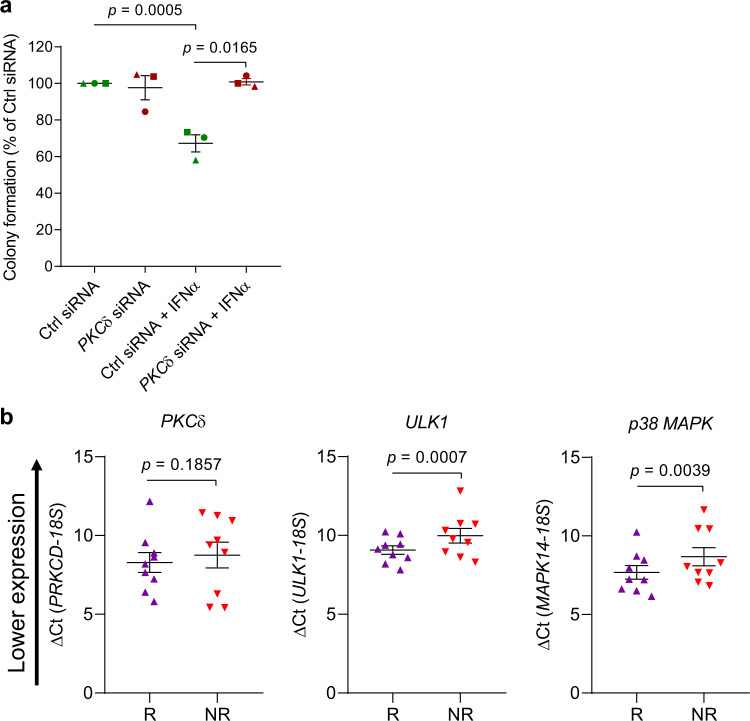
Fig. 3. Correlation between PKCδ, ULK1 and p38 MAPK expression and responsiveness to IFN treatment in primary MPN cells.
a Peripheral blood mononuclear cells from patients with PV were transfected with either control siRNA (Ctrl siRNA) or PKCδ siRNA, and the effects of IFNα treatment (103 IU/mL) on malignant erythroid (BFU-E) colony formation were assessed by clonogenic assays in methylcellulose. Data are expressed as percent colony formation relative to control siRNA-transfected untreated cells (Ctrl siRNA) and represent means ± SEM of three independent experiments, using cells from three different individual patients with PV. In the graph, data for the same individual patient is represented by the same symbol for each experimental condition. Statistical analyses were performed using a linear mixed effects model, with % colony formation relative to the control group as the outcome, treatment (the three remaining groups) as the fixed effect, and subject as a random effect to account for within-subject correlation between multiple conditions. Kenward-Roger degrees of freedom adjustment was used, which improves performance when sample size is small. Pairwise group comparison tests were adjusted for multiple comparisons using Tukey’s method. Statistical significant p-values (two-sided) are reported. b Correlation between PKCδ (PRKCD), ULK1, or p38 MAPK (MAPK14) baseline mRNA expression and clinical response of PV or ET patients to PEG-IFNα treatment (clinical trial #NCT01259817)7 based on a simplified, two-group criteria: R, responders (n = 9); NR, non-responders (n = 9). The clinical characteristics of each patient are provided in Supplementary Table 1. 18S gene expression was used as a reference gene. Data are expressed as ΔCt value for each gene, respectively (means ± SEM are shown). Statistical analyses were performed using linear mixed effects models77, with Ct as the outcome variable, and target (18S or one of PKCδ, ULK1 or MAPK14 genes), responder status (yes vs. no), and their interaction as fixed effects, and subject as the random effect to account for the correlation between within-subject replicates. Kenward-Roger degrees of freedom adjustment, which improves performance when sample size is small, was used. p-values (two-sided) are reported. Source data are provided as a Source Data file.

