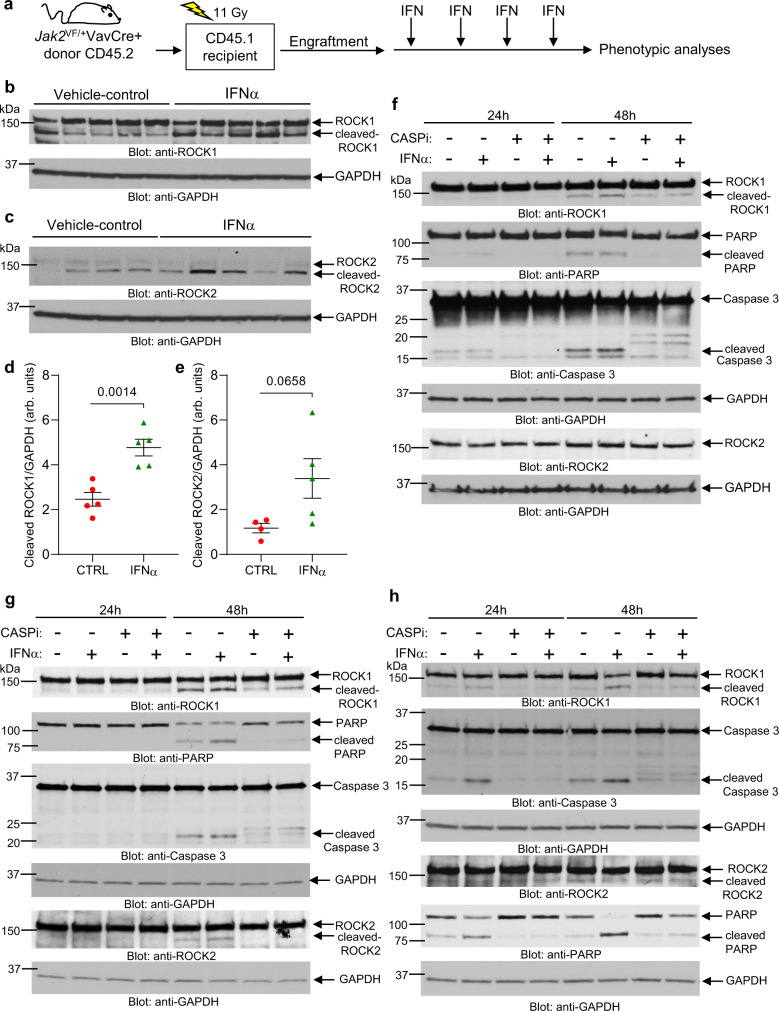
Fig. 5. IFNα treatment induces cleavage/activation of ROCK1 and ROCK2 in a mouse model of MPN and in hematopoietic malignant cells in vitro.
a–e CD45.1 mice were transplanted with Jak2V617F KI bone marrow cells isolated from JAK2V617F/+VavCre+ CD45.2 donor mice. Five weeks after transplantation and confirmation of engraftment (see Supplementary Fig. 6a–f), CD45.1 recipient mice were treated with murine PEG-IFNα once a week (600 ng/mouse, subcutaneous injection) for 4 weeks or vehicle (PBS). a Schematic illustration of the MPN mouse model and treatment regimen performed before phenotypic analyses. b, c Western blot analysis of ROCK1 and ROCK2 in mononuclear bone marrow cells isolated 4 weeks after initiation of vehicle-control treatment (n = 5 for ROCK1, n = 4 for ROCK2) or PEG-IFNα treatment (n = 5 for ROCK1 and ROCK2) of CD45.1 recipient mice. d, e Bands for cleaved-ROCK1, cleaved-ROCK2 and respective GAPDH shown in b and c were quantified by densitometry using ImageJ software. Quantified data are means ± SEM of cleaved ROCK/GAPDH and each data point represents data for one individual mouse. Two-sample two-tailed t-test was performed to calculate differences in cleaved ROCK1/2 between the two treatment groups. p-values are reported. arb. units, arbitrary units. See also Supplementary Fig. 6g–j. f–h Immunoblotting analysis of the indicated proteins in lysates from (f) HEL, (g) U937, and (h) KT-1 cells either left untreated or treated with IFNα (1000 IU/mL) and/or the caspase inhibitor (CASPi) Z-VAD-FMK (20 μM) for 24 or 48 h, as indicated. Blots are representative of two independent experiments for each cell line. Source data are provided as a Source Data file.

