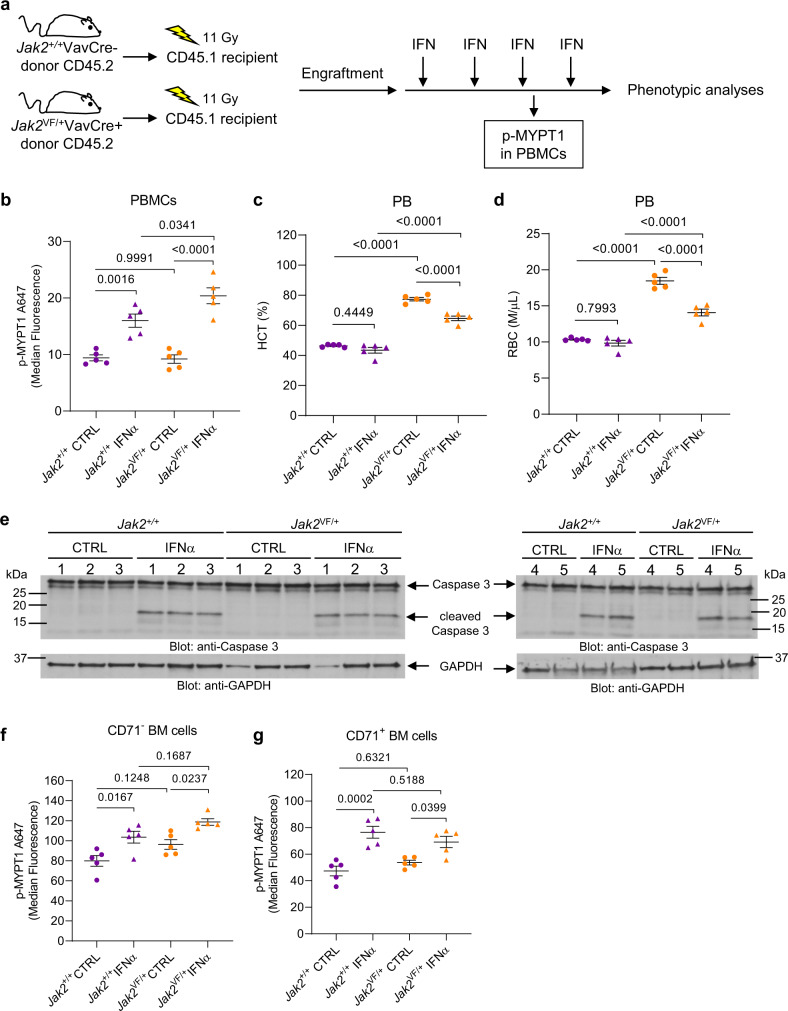
Fig. 6. PEG-IFNα treatment induces cleavage/activation of caspase 3 and phosphorylation of ROCK1/2 downstream target MYPT1 in Jak2+/+ and Jak2V617F/+ hematopoietic cells in vivo.
a–g CD45.1 mice were transplanted with either Jak2+/+ or Jak2V617F/+ KI bone marrow cells isolated from Jak2+/+VavCre- CD45.2 donor mice or Jak2V617F/+VavCre+ CD45.2 donor mice, respectively. Three weeks after transplantation and confirmation of engraftment (see Supplementary Fig. 7a–e), CD45.1 recipient mice were either treated with murine PEG-IFNα once a week (600 ng/mouse, subcutaneous injection) for 4 weeks or vehicle (PBS). a Schematic illustration of the in vivo models and treatment regimen performed before phenotypic analyses. Gy: gray units of ionizing radiation dose. b Scatter dot plots show median fluorescence of phosphorylated MYPT1 (p-MYPT1 A647) in Jak2+/+ (purple) or Jak2V617F/+ (orange) peripheral blood mononuclear cells (PBMCs) collected 24 h after the third dose of PEG-IFNα (triangles: Jak2+/+ IFNα n = 5 and Jak2VF/+ IFNα n = 5) or vehicle (circles: Jak2+/+ CTRL n = 5 and Jak2VF/+ CTRL n = 5). Data were assessed by flow cytometry and the gating strategy used is shown in Supplementary Fig. 7h. c, d Scatter dot plots show (c) hematocrit (HCT) and (d) red blood cell (RBC) counts of recipients from vehicle-control (Jak2+/+ CTRL n = 5 and Jak2VF/+ CTRL n = 5) and PEG-IFNα (Jak2+/+ IFNα n = 5 and Jak2VF/+ IFNα n = 5) groups after four doses of PBS (vehicle-control) or PEG-IFNα treatment. Data shown are means ± SEM. e Immunoblotting analysis of caspase 3 in lysates from bone marrow mononuclear cells (BMMCs) isolated from CD45.1 recipient mice 24 h after the fourth dose of PEG-IFNα (Jak2+/+ IFNα n = 5 and Jak2VF/+ IFNα n = 5) or vehicle (Jak2+/+ CTRL n = 5 and Jak2VF/+ CTRL n = 5), as indicated. f, g Scatter dot plots show median fluorescence of phosphorylated MYPT1 (p-MYPT1 A647) in Jak2+/+ or Jak2V617F/+ (f) CD71 negative (CD71-) and (g) CD71-positive (CD71+) BMMCs isolated from CD45.1 recipient mice 24 h after the fourth dose of PEG-IFNα (Jak2+/+ IFNα n = 5 and Jak2VF/+ IFNα n = 5) or vehicle (Jak2+/+ CTRL n = 5 and Jak2VF/+ CTRL n = 5). Data were assessed by flow cytometry and the gating strategy used is shown in Supplementary Fig. 7i. b–d, f, and g We used a two-way ANOVA to analyze the differences in b, f, and g p-MYPT1 median fluorescence, c percentage of HCT and d RBC counts with treatment (CTRL vs. IFNα), mutation (Jak2+/+ vs. Jak2VF/+) and their interaction as predictors. b The increase of MYPT1 phosphorylation induced by IFNα in Jak2+/+ PBMCs was smaller than in Jak2VF/+ PBMCs (p = 0.0382, interaction term). c The decrease of HCT percentage induced by IFNα in Jak2+/+ recipient mice was smaller than in Jak2VF/+ recipient mice (p = 0.0025, interaction term). d The decrease of RBC levels induced by IFNα in Jak2+/+ recipient mice was smaller than in Jak2VF/+ recipient mice (p = 0.0001, interaction term). f, g The difference in the increase of MYPT1 phosphorylation induced by IFNα in Jak2+/+ vs. Jak2VF/+ BM cells is not statistically significant (p > 0.05). Model-based pairwise comparisons were performed, and p-values were adjusted for multiple comparisons using Tukey’s method. p-values are reported. b–g Each data point or lane number represents data from an individual mouse. Results are representative of two independent in vivo studies. Source data are provided as a Source Data file.

