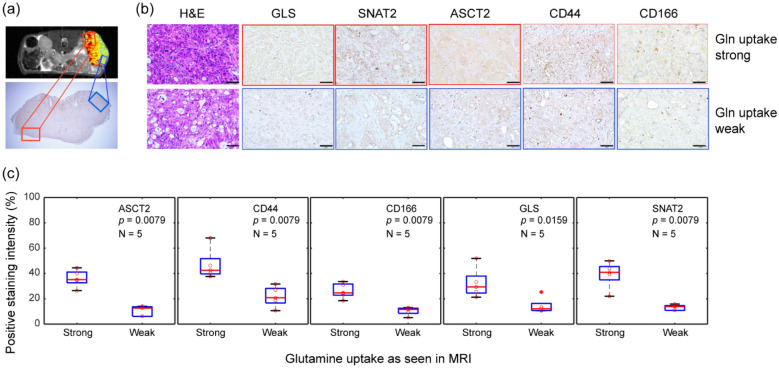
Figure 3.
Correlation between glutamine uptake in magnetic resonance imaging (MRI) and the expression of ASCT2 and CSC markers. (a) The xenograft HT29 tumor, which showed both strong glutamine uptake (marked in red) and weak glutamine uptake (marked in blue) in the MRI image was sectioned to verify the MRI results. The image of the tumor below was obtained after IHC staining for ASCT2 expression. Scale bar = 2 mm. (b) IHC staining for ASCT2, GLS, SNAT2, CD44, and CD166 expression in tumor regions that show strong (top row, outlined in red) and weak (bottom row, outlined in blue) glutamine uptake. Scale bar = 50 μm (c) The t-test results of IHC scores (ASCT2, CD44, and CD166). (n = 5 biologically independent samples per group).

