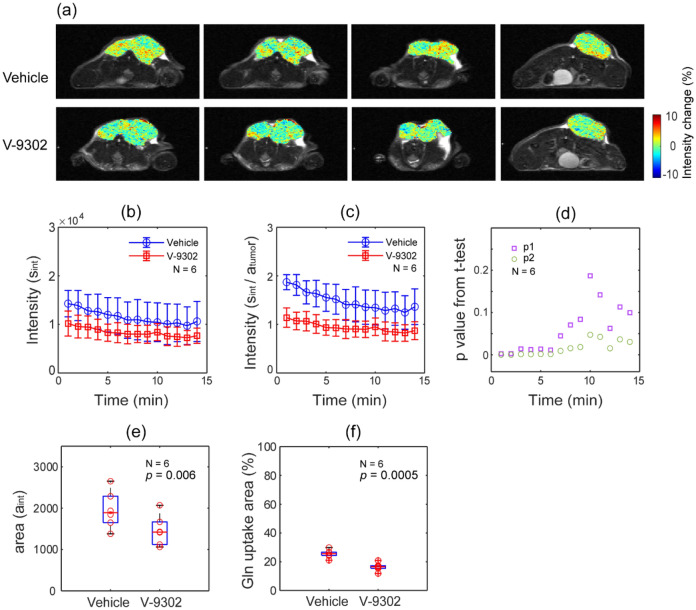
Figure 4.
Decreased glutamine uptake in MRI due to the pharmacological inhibition of ASCT2 expression. (a) Comparison of representative glutamine MRI images (vehicle vs V-9302 treated) from a single mouse at a similar location. (b) The sum of the intensity of pixels that show a change higher than 4% (sint) is plotted as a function of post-injection time for all six mice. (c) Data in (b) were divided by the tumor size (atumor) to account for the tumor growth during the 3 days between MRI scans. (d) p values (p1 from the t-test of sint (b)) and p2 from the t-test of sint/atumor (c) are presented for the post-injection time. (e) The tumor area as a number of pixels that show a change higher than 4% (aint). It shows reduced glutamine uptake in V-9302-injected mice. (f) The relative area of aint in the whole tumor, calculated using the formula (aint/atumor) × 100.

