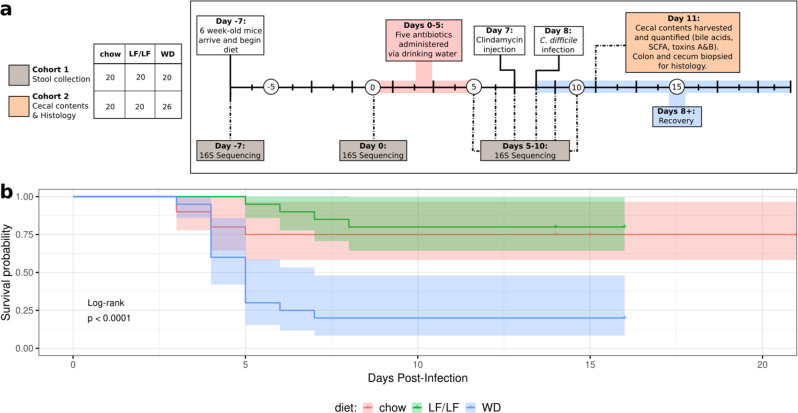
Fig. 1. Experimental design of the murine model of antibiotic-induced CDI and survival curves.
a C. difficile challenge experimental design. The figure legend at the left panel indicates the samples sizes for 2 cohorts; more information on batching and n’s per assay is given in Supplementary Table 2. Cohort 1 was followed for 13 days post C. difficile gavage to monitor survival and gut microbiome composition over time. Cohort 2 was sacrificed at 3 days post C. difficile gavage to collect cecal contents for measurement of metabolites and toxin and colon and cecal mucosa for histopathology (some assays were only conducted on a subset of Cohort 2, but all in at least two independent experiments; see Supplementary Table 2 for details). Gray and orange boxes indicate the time points at which samples were collected for the respective cohorts. b Survival curves on the three diets. Statistical significance as assessed by log-rank comparison is indicated.

