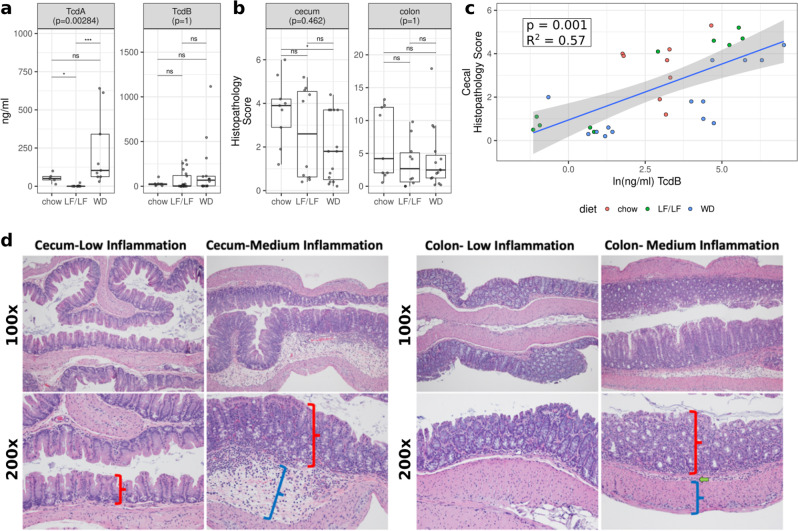
Fig. 2. Toxin and histopathology scores by diet.
a TcdA and TcdB production across diets as determined by ELISA. b Histologic inflammation scores across diets as determined by a blinded histologist. Significant differences were calculated with a Kruskal–Wallis and Dunn’s post hoc test. Kruskal–Wallis p-values were corrected for multiple comparisons with the FDR algorithm of Benjamini and Hochberg83. Also, see Supplementary Fig. 2 for statistical analysis with linear modeling that controlled for batch. Median and Interquartile Range (IQR) indicated. (*p< 0.05, **p < 0.01, ***p < 0.001, ****p< 0.0001). c Linear regression of cecal histopathology against C. difficile TcdB burden. (p = 0.001 with model cecum_infl ~TcdB and FDR correction). d Example sections of cecal (left) and colon (right) tissues with low or medium inflammation. No samples had levels of inflammation considered to be high. The cecum was scored for injury according to the system of Barthel et al. 200324. Scoring of inflammation using the Barthel scoring system is restricted to neutrophils in the mucosa portion of the cecum. In low cecal inflammation, no neutrophils are observed in the mucosa (red bracket) while they are observed with medium inflammation. Medium cecal inflammation also displayed submucosal edema (blue bracket) that is thought to occur at least to some degree due to the neutrophils present in the submucosa. The colon (right panels) was scored for injury according to the system of Dieleman et al. 199823. This system takes into account the relative quantity of inflammatory cells as well as whether they are found only in the mucosa layer (red bracket), are also in the submucosa (green arrow), or are found all the way through the muscularis (blue bracket) and into the peritoneal cavity.

