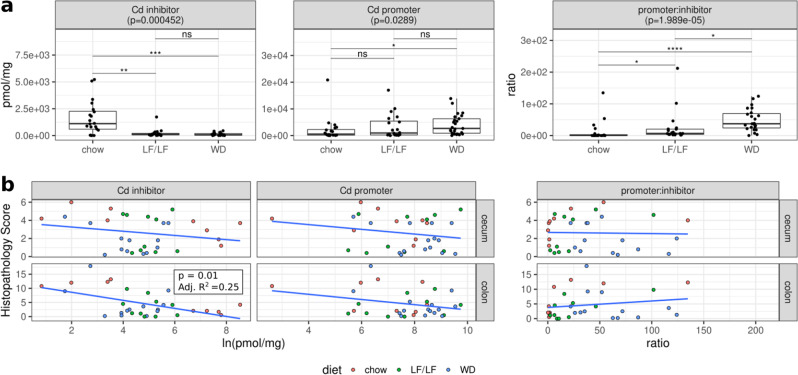
Fig. 3. Bile acid pools in cecal contents of infected mice 3 days post C. difficile infection.
a Cecal levels of C. difficile inhibitors (CDCA, UDCA, a_MCA, b_MCA, LCA, DCA), C. difficile promoters (TCA, CA), DCA, and ratios of promoters:inhibitors across diets (chow n;= 20, LF n = 20, WD n = 26; Supplementary Table 2). Significant differences calculated with a Kruskal–Wallis and Dunn’s post hoc test. Kruskal–Wallis p-values were corrected for multiple comparisons with the FDR algorithm of Benjamini and Hochberg. Median and IQR indicated. (*p < 0.05, **p < 0.01, ***p < 0.001, ****p < 0.0001). b Linear regressions of cecal or colonic histology against CD inhibitors, CD promoters, and the promoter:inhibitor ratios. Only colon inflammation versus C. difficile inhibitors was significant.

