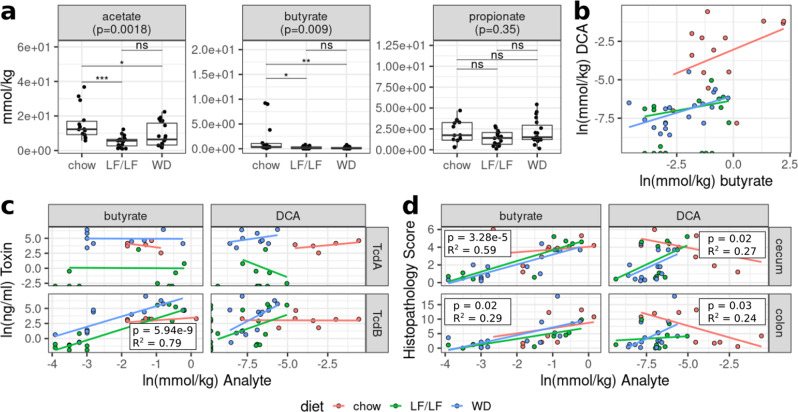
Fig. 4. Relationships between microbial metabolites (SCFAs and the secondary bile acid DCA) and diet, toxin, and inflammation.
a Cecal levels of the SCFAs acetate, butyrate, and propionate. p-values were determined using a Kruskal–Wallis with Dunn’s post hoc test. Median and IQR indicated. (*p < 0.05, **p < 0.01, ***p <0.001). b Multiple linear regression of DCA levels as a function of butyrate and diet. Model = ln(DCA) ~ln(butyrate) + diet + ln(butyrate)*diet. R-squared 0.855 p < 0.0001. c Multiple linear regressions of C. difficile toxin TcdA and TcdB concentrations against butyrate and DCA while controlling for dietary interactions. d Multiple linear regressions of cecal or colonic histology against butyrate and DCA while controlling for dietary interactions.

