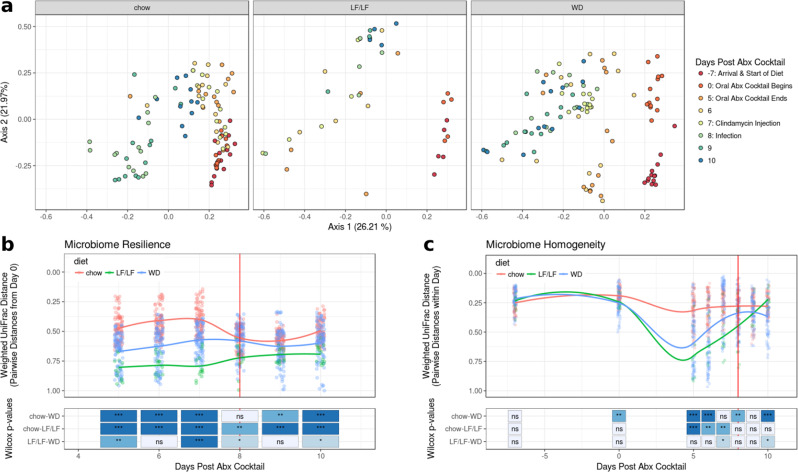
Fig. 5. Beta diversity plots of the fecal microbiome by diet during antibiotic treatment and infection with C. difficile.
Vertical red lines in b and c designate the day of C. difficile infection (chow n = 13, LF n = 5, WD n = 13). a Weighted UniFrac PCoA plots of all samples with each diet highlighted in separate panels. b Resilience of microbiome composition assessed by within-mouse pairwise weighted UniFrac distances between day 0 (7 days post diet switch and prior to oral antibiotics) and later time points and c Longitudinal plot of microbiome turnover homogeneity as plotted by intra-time point pairwise Weighted UniFrac distances within diet groups. Significant differences between diet groups were calculated by Kruskal–Wallis followed by Dunn’s post hoc test. Trend lines were fit using local polynomial regression. ***p < 0.001. **p < 0.01, *p < 0.05 ns non-significant.

