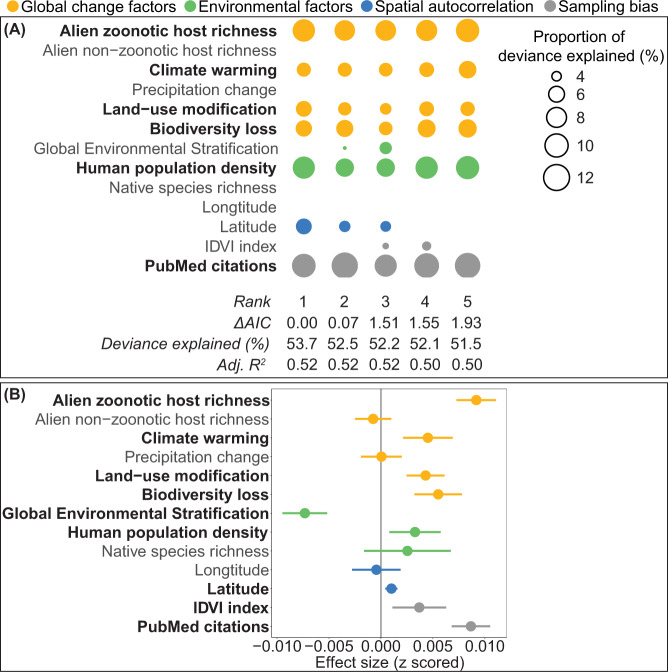
Fig. 3. Proportion of deviance explained and effect size of each predictor variable in model averaging analyses based on GAMMs.
Columns represent individual models and rows represent predictor variables, with smoothing function knot value = 10. Shown in bold are the variables that appear in all five of the most highly supported models in panel A and that have model-averaged 95% confidence intervals that do not overlap zero in panel B. The circle size in panel A represents the proportion of deviance explained by each predictor and any blanks indicate that the predictor is not included in the model. The panel B represents mean effect sizes with 95% confidence intervals of different predictor variables explaining the number of zoonosis events worldwide (n = 10,473, Supplementary Data 4).

