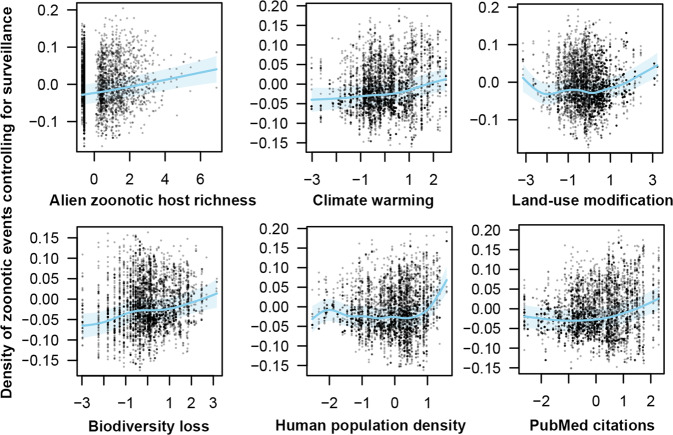
Fig. 4. Relationships of the six most important predictor variables with zoonosis emergences in the five highly supported models.
Scatter plots represent the partial residuals of each smoothed variable when controlling for other variables. Blue lines show the predicted function of each variable with mean and the shaded area as the 95% confidence band based on GAMMs. The dependent variable (zoonosis event density) is treated as the residuals of the fitted regression correlating the density of zoonosis events and the density of all disease events to account for the degree of overall disease surveillance (Supplementary Data 4). All predictor variables were standardized (to a mean of zero and standard deviation of one) before entering the model.

