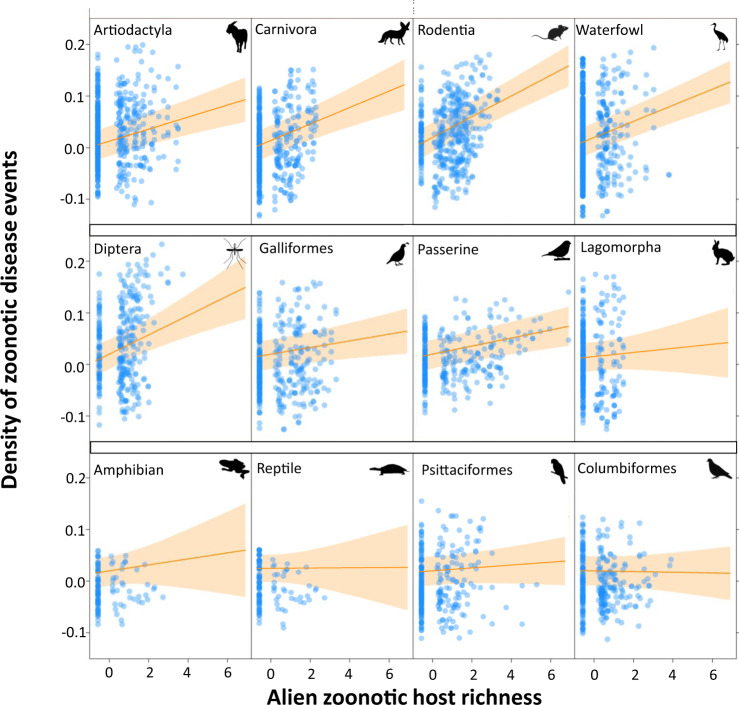
Fig. 5. The relationship of alien zoonotic animal richness and the zoonosis emergences across alien host groups.
The strength of each host group is tested by including an interaction between the richness of alien zoonotic species with each of the 12 host orders identified as important in the GAMMs after accounting for other co-factors. Each host order had established alien populations in at least 50 administrative units. Lines show the predicted relationship between density of zoonotic disease events and alien zoonotic host richness, with mean and the shaded area as the 95% confidence band (Supplementary Data 4). All predictor variables were standardized (to a mean of zero and standard deviation of one) before entering the model. Animal silhouettes were obtained from PhyloPic.

