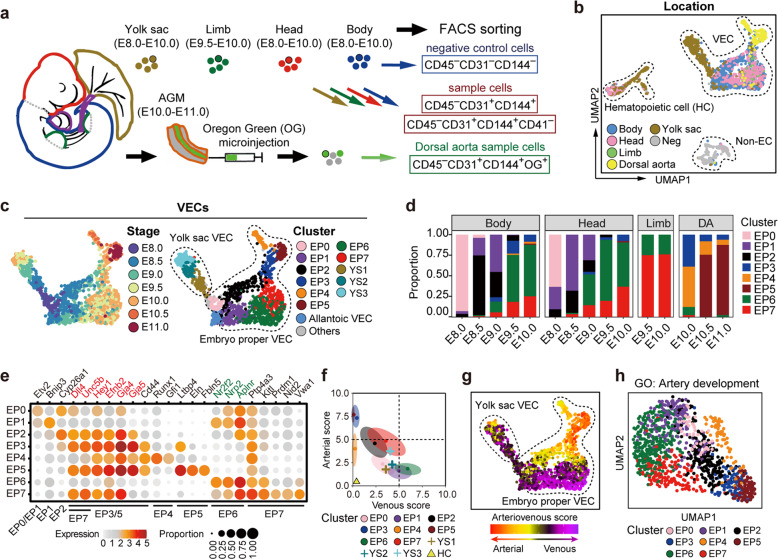
Fig. 1. Transcriptomic identification of diverse VEC populations in the mid-gestational mouse embryos.
a Schematic illustration of strategies used for embryo dissection and cell preparation for the subsequent scRNA-seq. Heart, visceral bud, and umbilical and vitelline vessels outside the embryo proper (purple) were excluded. b, c UMAP plots showing sampling locations of all sequenced cells (b) and stages (c) and further yielded twelve clusters (c) of all VECs. The main areas of three subtypes of cells (b), eight clusters from embryo proper (c) and three clusters from yolk sac (c) are indicated as closed dashed curves. d Bar graph showing the proportion of each VEC cluster at the corresponding locations and stages. DA, dorsal aorta. e Dot plot showing the average expression levels and expression proportions of key feature genes distinguishing eight embryo proper VEC clusters. The size of the dot represents the proportion of cells expressing the indicated gene within a cluster, and the color indicates the average expression level of cells within a cluster. Genes in red font indicate the known arterial genes, and those in green font indicate known venous genes. The clusters to which each feature gene belongs are shown at the bottom. Note that embryo proper VEC clusters showed a biased distribution of known arteriovenous markers expect for EP0. f Scatterplot showing the average arteriovenous scores of the cells in each cluster. Main distribution ranges of arteriovenous scores in each of the eight embryo proper VEC clusters are also indicated as an oval shape. g UMAP plots showing arterial/venous scores of the individual cells in VEC clusters. The main areas of embryo proper VECs and yolk sac VECs are indicated as closed dashed curves. h UMAP plot with cells colored by embryo proper VEC clusters. The UMAP coordinates were determined by using 107 genes in the GO term of artery development (GO: 0060840).

