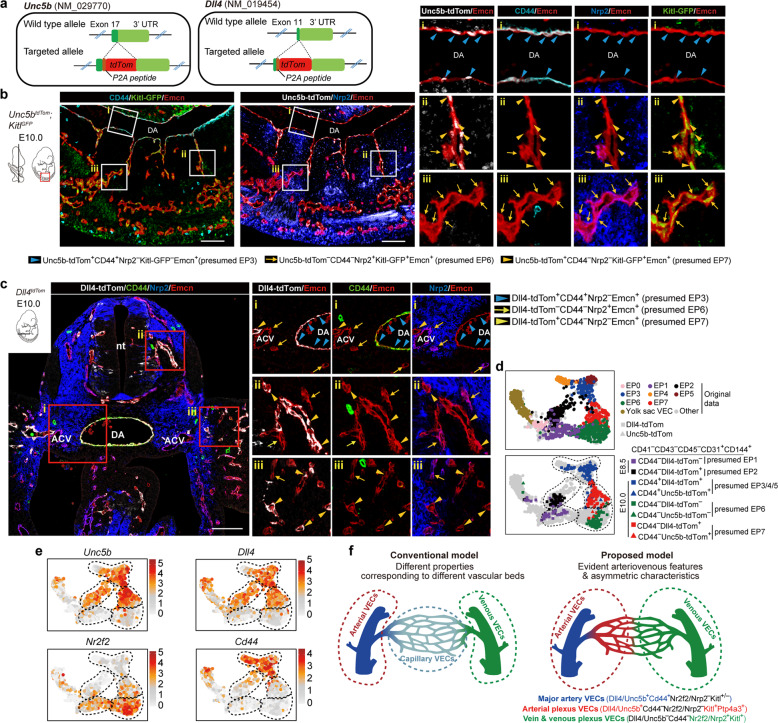
Fig. 2. Anatomical localization of distinct VEC populations in the embryo proper.
a Schematic models of the gene-targeting strategies for generating Unc5b-tdTomato (left) and Dll4-tdTomato (right) reporter mouse lines via CRISPR/Cas9 system. Note that the tdTomato cDNA was introduced between the last exon and the 3' UTR of mouse Unc5b or Dll4 genes to ensure that tdTomato was expressed in exactly the same way as the labeled genes without abolishing their function. b Representative immunostaining on sagittal sections of E10.0 Unc5b-tdTomato;Kitl-GFP embryos at body part. Note that the localization of major artery VECs (Unc5b-tdTom+CD44+Nrp2−Kitl-GFP−Endomucin+, blue arrowheads) at known arteries such as the dorsal aorta, EP7 VECs (Unc5b-tdTom+CD44−Nrp2−Kitl-GFP+Endomucin+, yellow arrowheads) at intersegmental arteries and vascular plexus, and EP6 VECs (Unc5b-tdTom−CD44−Nrp2+Kitl-GFP+Endomucin+, yellow arrows) at vascular plexus adjacent to EP7. Unc5b+ arterial VECs and Nrp2+ venous VECs displayed a largely complementary expression pattern, and they comprised most VECs in mid-gestational embryos. Images in white boxes are shown at high magnification. The diagrams on the left indicate the positions of sections and imaging. DA, dorsal aorta. Scale bars, 100 μm. c Representative immunostaining on cross sections of E10.0 Dll4-tdTomato embryos at body part. Note the localization of major artery VECs (Dll4-tdTom+CD44+Nrp2−Endomucin+, blue arrowheads) at known arteries such as DA, EP6 VECs (Dll4-tdTom−CD44−Nrp2+Endomucin+, yellow arrows) at vascular plexus and known veins such as ACVs, and EP7 VECs (Dll4-tdTom+CD44−Nrp2−Endomucin+, yellow arrowheads) at vascular plexus adjacent to EP6. Images in red boxes are shown at high magnification. The diagram on the upper left indicates the position of sections. nt, neural tube; ACV, anterior cardinal vein; DA, dorsal aorta. Scale bars, 100 μm. d UMAP plots combining VECs from our original data and those from arterial reporter mouse models including Dll4-tdTomato and Unc5b-tdTomato embryos. Note that the indicated marker combinations at given developmental stages effectively distinguish the in silico-identified main VEC populations, which are outlined in dashed curves. e UMAP plots showing the expression levels of indicated arteriovenous marker genes. Dashed outlines of different VEC populations are also indicated. f Schematic diagram of the conventional model (left) and proposed model in the present study (right) illustrating the molecular characteristics of early intra-embryonic vasculatures. The dashed circles in red and green correspond to arterial and venous VECs, respectively.

