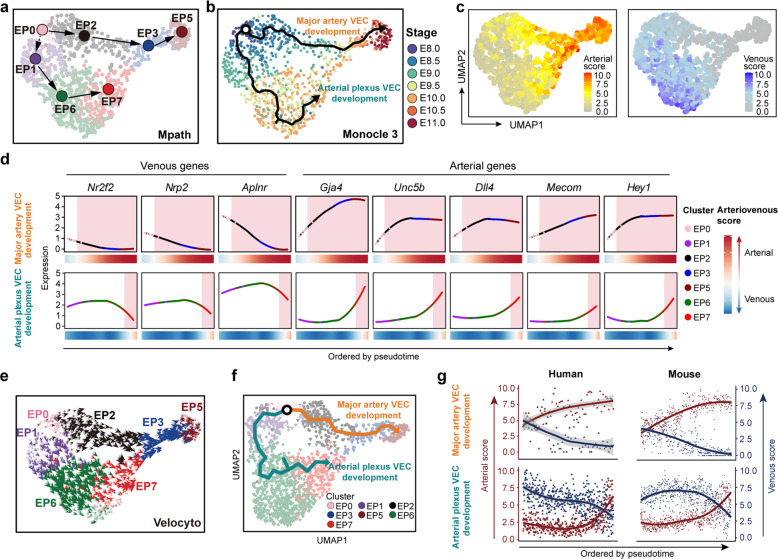
Fig. 5. Computational analysis predicted the basically conserved development paths of two types of arterial VECs between human and mouse.
a Developmental trajectory among embryo proper VEC clusters inferred by Mpath. The directional arrows are inferred by Mpath and sampling stages. b Trajectory of cells in embryo proper VEC clusters inferred by monocle 3 showed two major directions mapped with sampling stages, which largely recapitulated the actual temporal order of the sampled cells. c UMAP plots showing arterial (left) and venous (right) scores of the individual cells in the embryo proper VEC group. d Loess regression-smoothened expression of the indicated venous and arterial marker genes along two distinct arterial VEC development paths inferred by Monocle 3. Smoothened arteriovenous scores are also shown at the bottom. Red shading, arterial-featured VEC populations. e Velocity vector field displayed on the UMAP plot at single-cell level, with each arrow colored by cluster showing the movement direction and speed of each individual cell, indicating two waves of arterial differentiation, one of which was presumably derived from vein & venous plexus VECs (EP6). f UMAP plot showing the trajectory inferred by Monocle 3, which identified two predominant paths from primordial VECs. g Scatter plots showing arterial (red) and venous (blue) scores of the cells along major artery VEC development (upper) and artery plexus VEC development (lower) paths, with loess-smoothed fit curves indicated. VECs from human and mouse embryos are illustrated separately, and cells are ordered by pseudotime.

