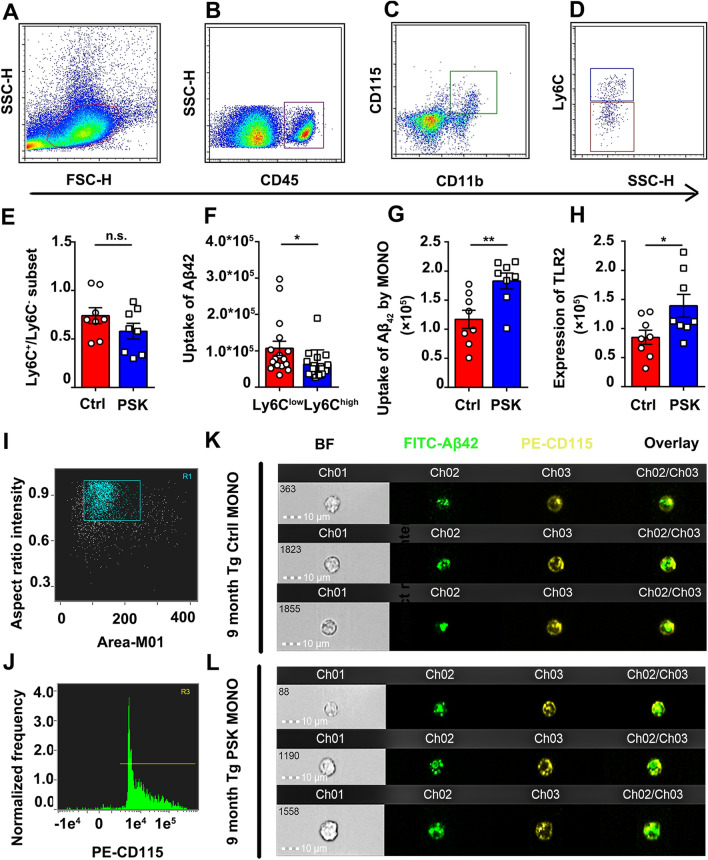
Fig. 5.
Flow and imaging flow cytometry analysis of Aβ42 uptake by mouse monocytes. A, B After morphological gating, mononuclear cells are selected as CD45-positive events. C, D Mouse monocytes are further identified as CD11bpos/CD115pos events and subsequently gated as Ly6Chigh and Ly6Clow/neg subsets. E, F Aβ42 uptake in monocyte subsets and effects of PSK on proportions of monocyte subsets, G, H Aβ42 uptake and TLR2 expression in monocytes in control and PSK groups. I, J By imaging flow cytometry, cells with high-intensity CD115 labelling are selected as mouse monocytes, followed by selection of single cells gated on the area and aspect ratio of the bright-field image. K, L Images of FITC-labelled Aβ42 uptake by mouse monocytes. n = 8 per group; mean ± SEM; *P <0.05, **P <0.01, n.s, not significantly different, Student’s t-test. FSC, forward-scatter; SSC, side-scatter; PSK, polysaccharide kestin; Ctrl, control; WT, wild-type; Tg, transgenic; Aβ, amyloid-β.

