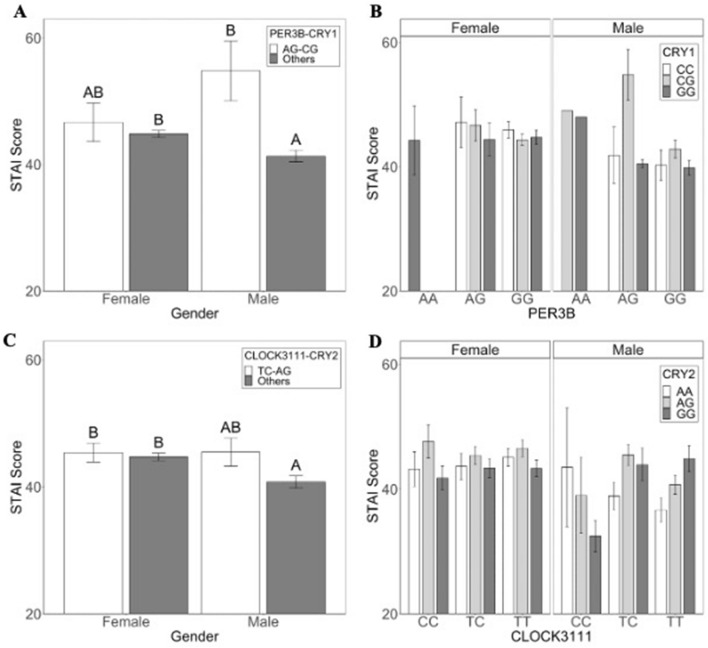
Figure 2.
Genotype combinations predictive of anxiety symptoms in males. (A,B) Average anxiety scores for males with a combination of PER3B-AG and CRY1-CG are higher than average anxiety scores of individuals with other genotype combinations (Gender: F1, 479 = 0.661, p = 0.417, Genotype: F1, 479 = 7.174, p = 0.008; Gender x Genotype: F1, 479 = 4.141, p = 0.042). Anxiety scores are measured using the self-reported State-Trait Anxiety Index (± 1 SE). Tukey’s posthoc tests showed that males with AC-CG combination were significantly different from males with other genotypes and from females. (C,D) Average anxiety scores of males with a combination of CLOCK3111-TC and CRY2-AG also tend to be higher than average anxiety scores of individuals with other genotype combinations, but this is not significant at p < 0.05. (Gender: F1, 517 = 1.773; p = 0.184 , Genotype:F1, 517 = 3.417; p = 0.065; Gender x Genotype: F1, 517 = 1.912, p = 0.167).

