
Fig. 1. Air quality in Davis/Woodland, California.
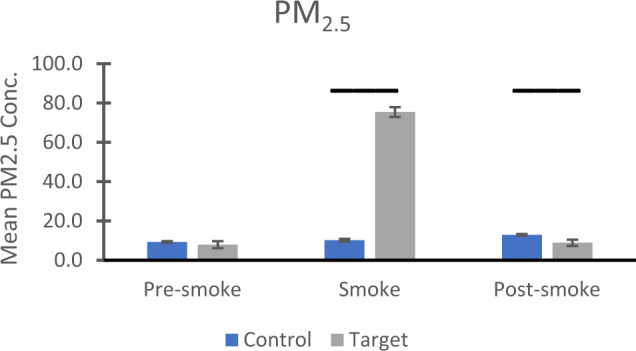
Mean and standard errors for PM2.5 values (in µg/m3) for three time periods based on estimated conception dates: pre-smoke (9 October–8 November), smoke (9–22 November), and post-smoke (23 Nov–27 December). Control group refers to animals conceived between 2000-2017 inclusive; target group pertains to animals conceived in 2018. Values shown are from raw data; for statistical analysis, values were log10-transformed. Bars show significant, Bonferroni-corrected, follow-up effects from a significant interaction with the transformed data. Higher PM2.5 concentrations were seen in the target group during the smoke period (p < .001) and in the control group in the post-smoke period (p = .009). For the control years (conceptions during 2000-2017), number of observations were 433, 213, and 514 for pre-smoke, smoke, and post-smoke. For the target year (conceptions in 2018), observation numbers were 28, 14, and 35 for the same three conditions, respectively. Source data are presented in a Source Data file.