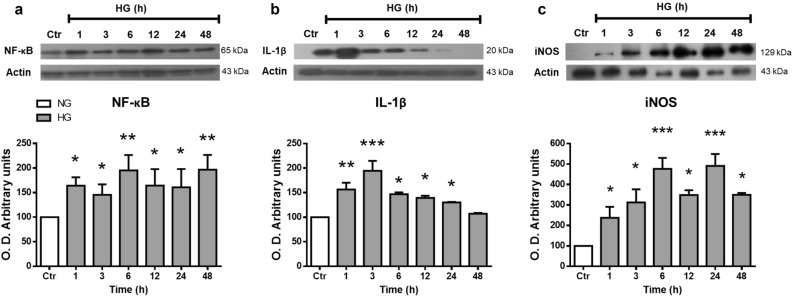
Figure 7.
High glucose concentrations induced the expression of inflammatory proteins in MC. Western blot analysis of NF-κB (a), IL-1β (b), and iNOS (c) expression in homogenates from MC exposed to NG (Ctr) or HG for different time periods (1–48 h). The upper part, representative western blot. The lower part, quantification of the expression levels. The relative expression levels were normalized using actin. Values are the mean ± SEM (n = 5 per group) carried out in duplicate. NG, normal glucose; HG, high glucose. *p < 0.05 with respect to NG, ***p < 0.001 with respect to NG. Full-size blots are presented in Supplementary Fig. 6.

