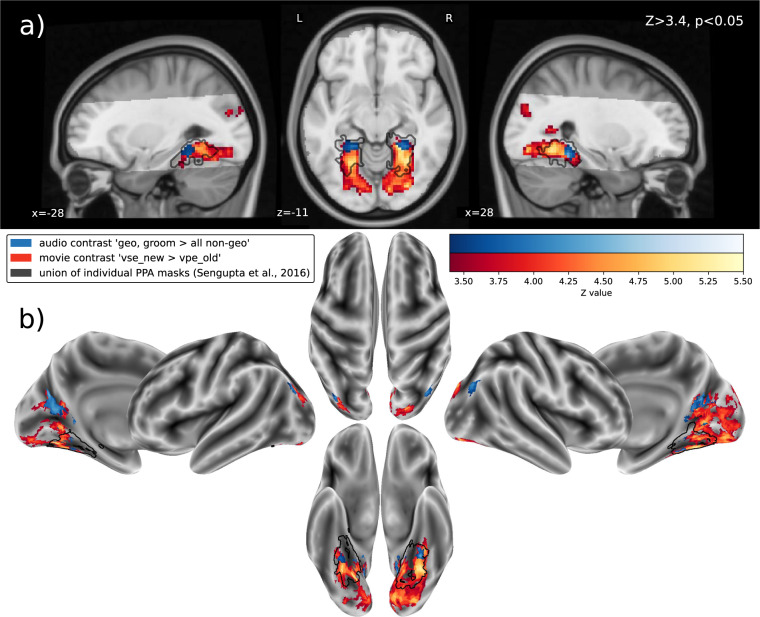
Fig. 1.
Mixed-effects group-level (N = 14) clusters (Z > 3.4; p < 0.05, cluster-corrected) of activity correlated with the processing of spatial information. The results of the audio-description’s primary t-contrast (blue) that compares geometry-related nouns spoken by the narrator to non-spatial nouns (geo, groom > all non-spatial categories) are overlaid on the movie’s primary t-contrast (red) that compares cuts to a setting depicted for the first time to cuts within a recurring setting (vse_new > vpe_old). (a) results as brain slices on top of the MNI152 T1-weighted head template, with the acquisition field-of-view for the audio-description study highlighted. For comparison depicted as a black outline, the union of the individual PPA localizations reported by Sengupta et al.24 that was spatially smoothed by applying a Gaussian kernel with full width at half maximum (FWHM) of 2.0 mm. (b) results projected onto the reconstructed surface of the MNI152 T1-weighted brain template. After projection, the union of individual PPA localizations was spatially smoothed by a Gaussian kernel with FWHM of 2.0 mm.

