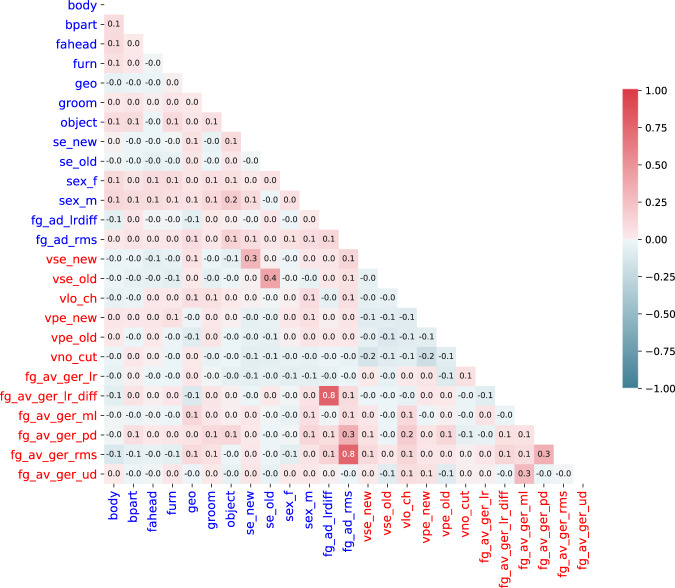
Fig. 4.
Pearson correlation coefficients of model response time series used as regressors in the GLM analysis of the audio-description (blue; see Table 3 for a description) and audio-visual movie (red; see Table 3). Values are rounded to the nearest tenth. The correlation between the two stimuli’s root mean square volume and between their left-right difference in volume yielded the highest correlation values (fg_ad_rms and fg_av_ger_rms, r = 0.7635; fg_ad_lrdiff and fg_av_ger_lrdiff, r = 0.7749).

