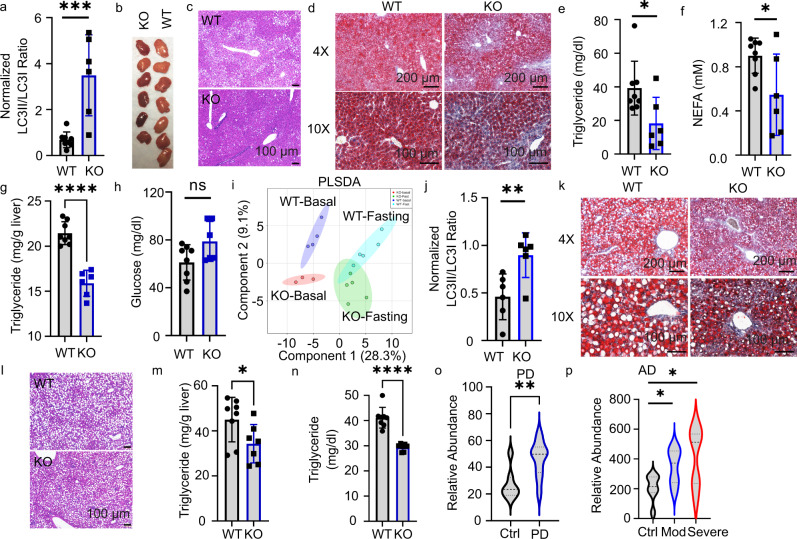
Fig. 4. STK11IP deficiency protects mice against metabolic disorder.
a STK11IP KO leads to increased autophagy in the mice after 36 h of fasting. WT wild type, KO STK11IP knockout. 3-month-old, WT, n = 8; KO, n = 6 mice. ***P = 0.0001, ***P = 0.0008. b Images of the liver from STK11IP WT and KO mice after 36 h of fasting (3-month-old, WT, n = 7; KO, n = 6 mice). c, d Histological sections (H&E staining) c and Oil-Red staining d of the liver from STK11IP WT and KO mice. The mice (4-month-old) were subject to 36 h of fasting after 2-month-HFD diet. (WT, n = 10; KO, n = 9 mice). Scales bars, 100 μm or 200 μm as indicated. e–h Blood triglycerides e, NEFA (non-esterified fatty acids) f, liver triglycerides g, and blood glucose h levels in the STK11IP WT and KO mice after 36 h of fasting. 3-month-old, WT, n = 8; KO, n = 6. *P = 0.03, *P = 0.0305, ****P < 0.0001, n.s, not significant. i Partial least squares discriminant analysis (PLSDA) of the blood metabolites from STK11IP WT or KO mice (3-month-old, WT-basal, n = 4; WT-Fasting, n = 5; KO-basal, n = 3; KO-fasting, n = 5 mice). j Statistics of the LC3II/LC3I ratio in the liver from STK11IP WT or KO mice (2-month-old) with 2 weeks of the MCD diet. n = 6 mice. **P = 0.0096. k, l Oil-Red staining (k) and histological sections (H&E staining) (l) of the liver from STK11IP WT or KO mice after 2 weeks of MCD diet. (WT, n = 8; KO, n = 7). Scales bars, 100 μm. m, n Blood triglycerides m and liver triglycerides n levels in STK11IP WT or KO mice (2-month-old) after 2 weeks of MCD diet. WT, n = 8; KO, n = 7 mice. *P = 0.0437, ****P < 0.0001. o, p STK11IP expression is increased in neurogenerative diseases. STK11IP expression in control individuals, or patients with Parkinson’s disease (o: PD) or Alzheimer’s disease (p: AD). The data were extracted from the database with a reference number of GSM184355 (PD) and GSM697332 (AD), respectively; (normal: n = 7, PD: n = 17; n = 7 for each group in AD). ****P = 0.0035, *P = 0.0269, *P = 0.0262. All of the statistical results represent mean ± SEM, the statistical significance was calculated with unpaired two-tailed Student’s t tests. Source data are provided as a Source Data file.

