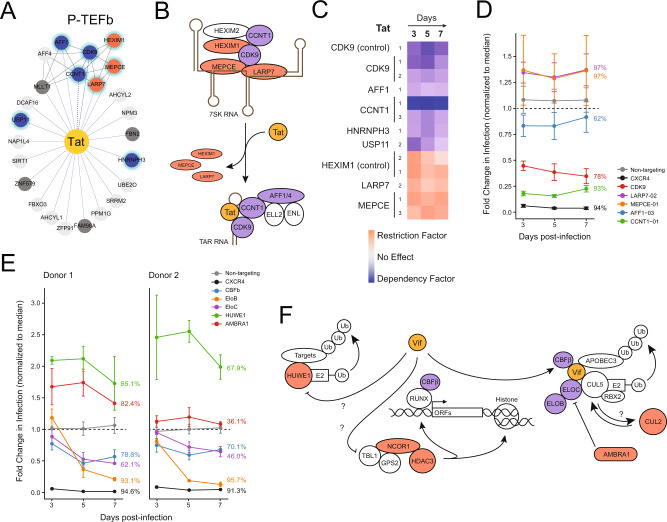
Fig. 4. A functional map of HIV Tat and Vif complexes.
A HIV Tat (yellow) is connected by blue edges to protein–protein interactors; black edges connect known human complexes (Corum database)23,77. Candidate or known dependency and restriction factors are annotated with blue and red nodes, respectively; all Tat interactors have early-acting phenotypes and thus are annotated with green halos. Factors determined to have no functional role in HIV infection are light gray, while those of undetermined phenotype are in dark gray. B A schematic model of superelongation complex formation by HIV Tat. Host factors with identified dependency or restriction factor phenotypes in the study are colored blue or red, respectively. C Heatmap of the donor-average log2-normalized HIV-infection rate at each timepoint for each gRNA called as a hit (purple = decreased infection, pink = increased infection), focused on Tat-interacting factors. D Fold change in HIV infection upon knockout of a subset of Tat interactors. Points represent an average of three technical replicates in cells from two donors ±SD. Average mutational efficiency of each guide across donors is annotated at the right of each line. E Fold change in HIV infection upon knockout of a subset of Vif interactors. Points represent an average of three technical replicates ±SD for two donors plotted independently. The mutational efficiency of each guide is annotated at the right of each line. F Schematic depicting putative functions of known and novel HIV Vif-interacting PPIs. Shading indicates dependency (blue) or restriction factors (red) in this study.

