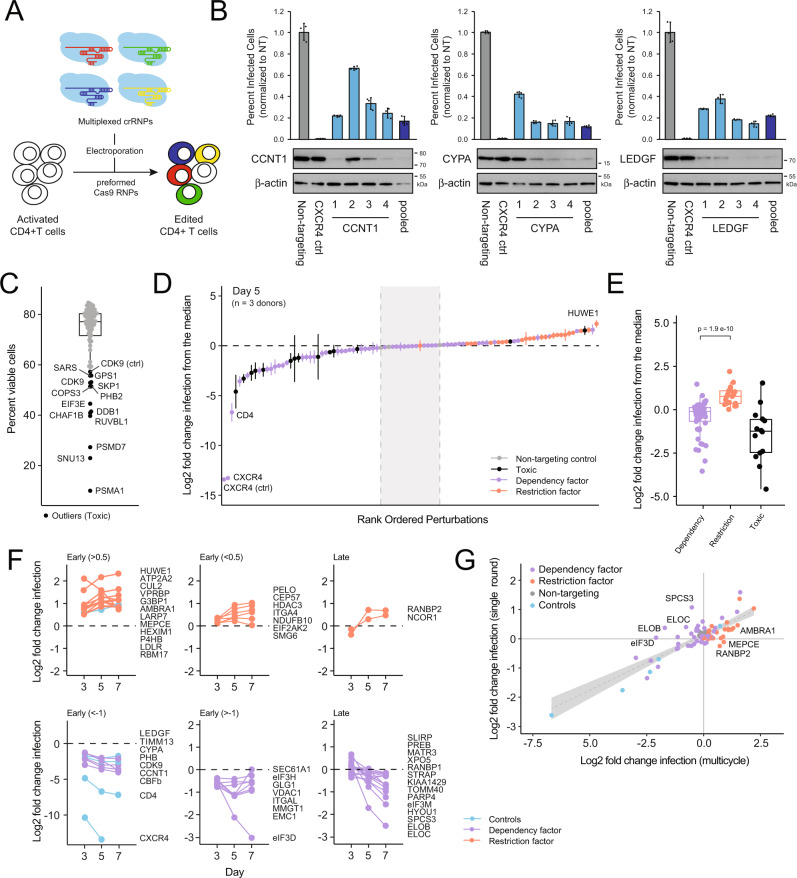
Fig. 6. Hit validation using multiplexed gRNA.
A Schematic of the multiplex gRNA approach for gene knock out in primary CD4+ T cells. B Bar charts depicting percent HIV-infected cells post challenge upon knockout with individual gRNA 1 through 4 versus a multiplexed pool of gRNAs 1 through 4 (average of technical triplicates ±SD). Western blots below depict protein depletion for each targeted gene. Three independent loci were targeted: CCNT1 (left), CYPA (middle), and LEDGF (right). C Box-and-whisker plot of the average percent of live CD4 + T cells in each well four days after electroporation with multiplexed gRNA; center line, median; box limits, upper and lower quartiles; whiskers, 1.5x interquartile range; black points, outliers. Outlier points are considered toxic and are labeled by targeted gene name. D S-curve plot of the log2 fold change in infection relative to the plate median at day 5 for each multiplexed gRNA, averaged across all 3 donors ±SD. The dashed black line indicates the median; the dashed gray lines represent the nontargeting range. Dots are colored by toxicity and by phenotype in the original screen as indicated. E Box-and-whisker plot of the distribution of log2-normalized HIV-infection rates for dependency factors (n = 52) versus restriction factors (n = 21) versus essential genes (n = 13) at day 5. Center line, median; box limits, upper and lower quartiles; whiskers, 1.5x interquartile range; p-value reflects a two-sided Wilcoxon rank-sum test comparing dependency factors and restriction factors each measured in three biologically independent replicates. F Line chart of log2-normalized HIV-infection rates over time for each validated hit (two-sided Wilcoxon rank-sum test, p-value < 0.1 at multiple timepoints). Restriction factors are shown above and dependency factors shown below with relevant controls. Genes with significant differences at day 3 are coded “early” and sorted by magnitude of effect; genes with significant differences at only days 5 or 7 are coded as “late”. G Log2-normalized HIV-infection rates at day 5 after multicycle replication versus at day 3 after single-cycle replication in the presence of Saquinavir. The linear regression line with 95% confidence interval is shown in gray.

