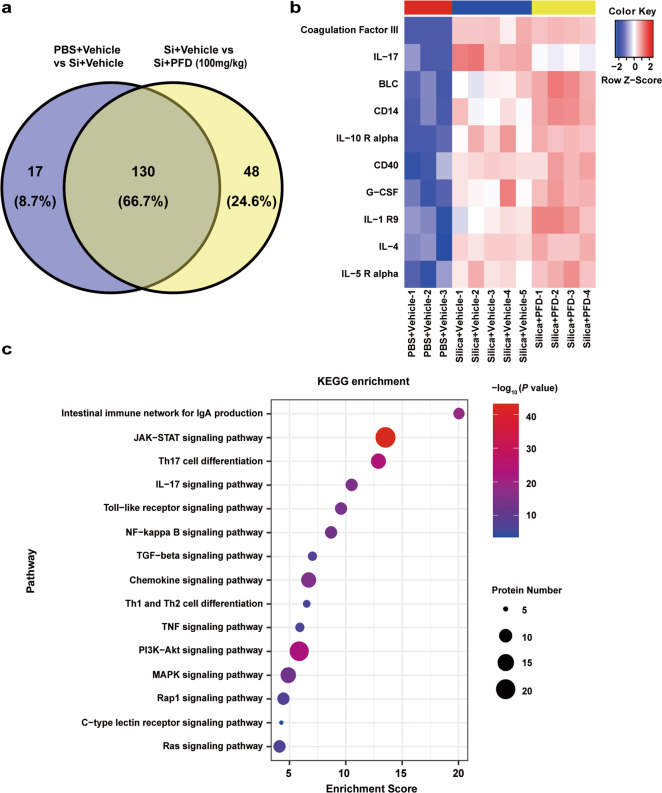
Fig. 2. Bioinformatic analysis for the antibody array.
a Venn diagram shows that the 147 serum proteins were related to silica exposure and 178 serum proteins were related to pirfenidone treatment, with 130 overlapping differentially regulated proteins related to both silica exposure and pirfenidone treatment (n = 3 for PBS + Vehicle; n = 5 for Si + Vehicle; n = 4 for Si + 100 mg/kg PFD). b Heatmap shows expression of the top 10 proteins in the group of 130 proteins (ranked by P value). c Functional enrichment analysis of the 130 proteins based on KEGG.

