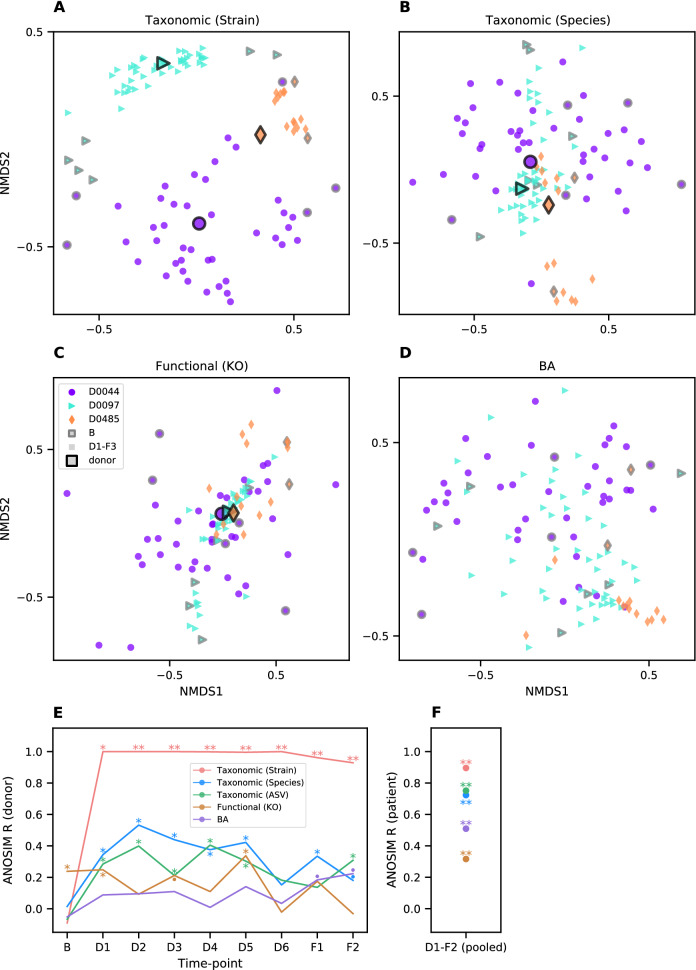
Figure 2.
Samples cluster within patient and donor groups during and after FMT treatment. (A–D) Non-metric multidimensional scalings were calculated from pairwise sample comparisons based on BC dissimilarity of taxonomic profiles from shotgun metagenomes at strain (A), and species resolution (B), and on cosine dissimilarity of functional gene (C) and BA profiles (D). The orientations and scales of axes are arbitrary, and proximity on a plot reflects similarity. Markers represent individual fecal samples from patients (no black outline) or the mean of all samples from a single donor (black outlines). Shapes and colors are matched between patients and their respective donors. Patients’ baseline samples are outlined in grey. Identical ordinations colored by individual subjects are available in Supplementary Fig. S1. (E,F) ANOSIM R scores, an index of clustering strength based on pairwise sample dissimilarities, for the four profiles from (A–D) as well as an additional taxonomic profile based on 16S rRNA gene ASVs. Larger R values indicate stronger clustering by donor at each time point (E) or by patient across pooled time points (F). Significance, as assessed by ANOSIM permutation test (n = 9999): p ≤ 0.1 (▪), p ≤ 0.05 (*), p ≤ 0.001 (**).

