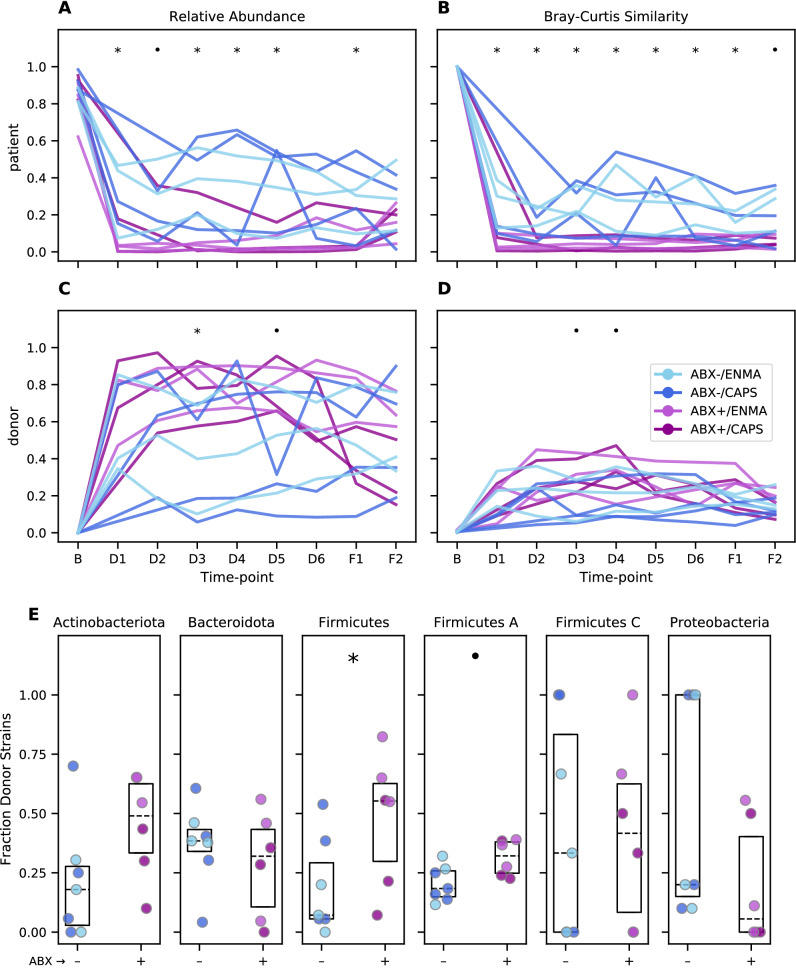
Figure 3.
Greater community perturbation and engraftment of donor strains following FMT treatment in antibiotic-pretreated patients. (A,C) Abundance of strains specific to each patient’s baseline sample (A) or specific to each donor sample (C) relative to the patient’s total strain populations over the course of treatment. (B,D) BC similarity (1—BC dissimilarity) between each patient’s sample and that patient’s own baseline (B) or their assigned donor (D). (E) Fraction of donor strains detected in each patient’s fecal samples at F1. Each dot represents a patient, colors are as in (A–D). Boxes span the interquartile range with the median also marked (dotted line). In all panels, symbols indicate individual time points (A–D) and taxa (E) with p-values less than 0.1 (·) or 0.05 (*) by MWU test for differences between patients who did or did not receive antibiotic pretreatment.

