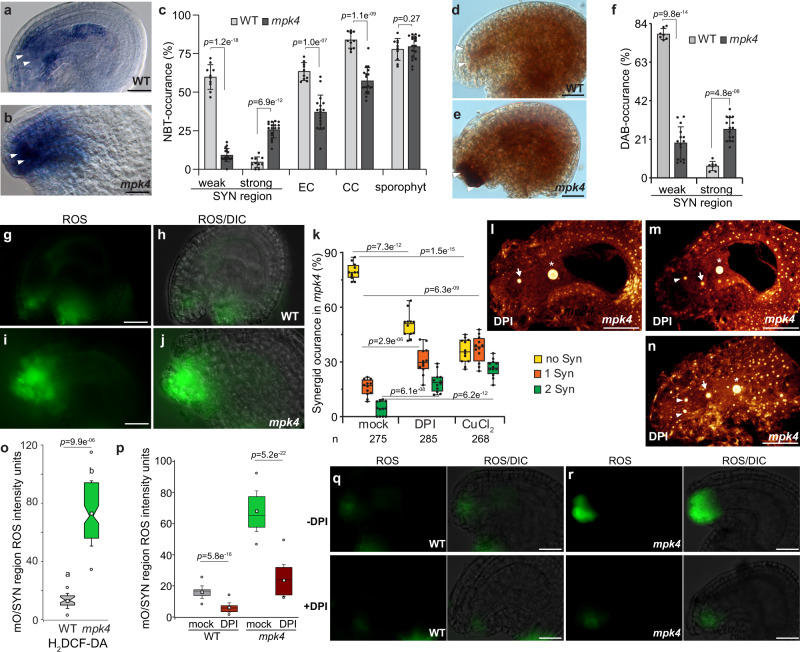
Fig. 3. MPK4 inhibits a ROS maximum at the entrance of the female gametophyte.
a–c Superoxide detection in the sporophytic ovule tissue and the female gametophyte following nitroblue tetrazolium (NBT)-staining in WT (n = 281) and mpk4 (n = 272), three biological replicates analyzed. d–f Hydrogen peroxide detection in the sporophytic ovule tissue and the female gametophyte following diaminobenzidine (DAB)-staining in WT (n = 203) and mpk4 (n = 152), three biological replicates analyzed. g–j, o ROS accumulation in WT (g, h) and mpk4 (i, j) in the micropylar ovule (mO) region shown by H2DCF-DA staining. o Quantification of ROS-intensity units (arbitrary) in WT (n = 283) and mpk4 (n = 196) by imageJ. Boxes represent the 25th and 75th percentiles, and the inner rectangle highlights the median, whiskers show the SD, and outliers are depicted by dots (Min/max range). mO/SYN, micropylar ovule/synergid region. k–n Pistil-feeding assay by the use of ROS scavengers: mpk4 pistils of flowers at developmental stage 12b/c (Christensen et al. 22) were treated with mock, DPI (250 µM) or CuCl2 (1 mM) for 24 h and subsequently analyzed for synergid preservation by DIC analysis. Representative images after ROS scavenger-application are shown by maximum projections of Z-stacks l–n. Three biological replicates with a total of 275 (mock), 285 (DPI) and 268 (CuCl2) mpk4 ovules were analyzed. p–r Reduction of micropylar ovular ROS maximum in WT and mpk4 by DPI-application (250 µM). Quantification of ROS-intensity units (arbitrary) in WT and mpk4 by imageJ. Boxes represent the 25th and 75th percentiles, and the inner rectangle highlights the median, whiskers show the SD, and outliers are depicted by dots (Min/max range). mO/SYN, micropylar ovule/synergid area. Three biological replicates were performed with similar results and depicted are the results of the first replicate. Statistical significance was analyzed by one-way ANOVA. Source data and further statistical analysis are provided in the source data file. Error bars show ± SD. White arrowhead, synergid; white arrow, egg cell; white asterisk, the central cell nucleus. Scale bars, 20 µm.

